'Think outside the Show Me Box': Recreating Photoshop in Tableau


Note: This is a guest post by Merlijn Buit, a Tableau consultant at Infotopics in the Netherlands.
When people ask me why I do the things I do, my answer is simple: Why not? Just try new things and see where it ends. Be creative! That’s why I teamed up with my Infotopics colleague Ludo Koelman to recreate Photoshop in Tableau.
1. Thinking Outside the Show Me Box
Creativity is not an activity; it's a mindset. It all starts with thinking in possibilities. Think outside the Show Me box. Even if there’s a direct application, you will always learn, be inspired—or, hopefully, be inspiring—by taking the scenic route.
Together with my colleagues at Infotopics, I strive to create a world in which everybody can make well-founded decisions based on transparent data. With that in mind, we build beautiful dashboards in Tableau.
This project with Ludo started with a challenge we set for ourselves. We wanted to not just turn our own thinking upside down; we were going to flip over the whole concept of data visualization. Instead of going from data to visuals, we wanted to go from visuals to data. One thing led to another. After starting with “let’s visualize a picture in Tableau,” we soon ended up with “let’s rebuild Photoshop.” Why? Why not! I’m not a programmer or a photographer; I’m just inconceivably curious.
This project started without a clear goal, but it was the ultimate opportunity to learn about the unknown. How will Tableau handle a scatter plot with hundreds of thousands of marks, for example? And how can we produce a lot of complex calculations using the fewest calculated fields possible?
2. The Journey from Image to Data
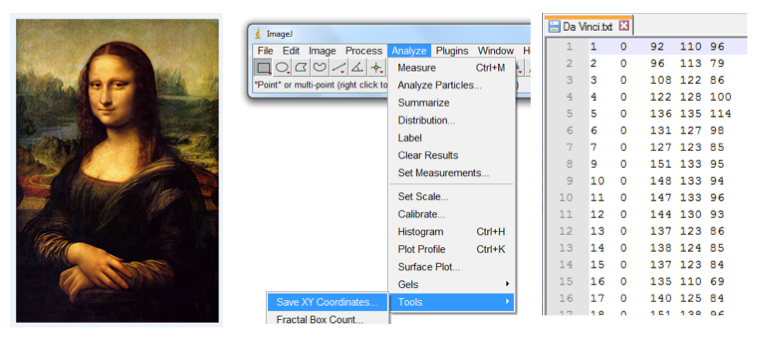
The first step in the process involved converting an image into data. We had to find a software that could convert pixels into raw data. We needed something like X, Y, and color. After searching on the internet, I found a tool called ImageJ, which proved useful in converting our choice of image, the Mona Lisa, into raw, structured data:
3. Colorizing in Tableau
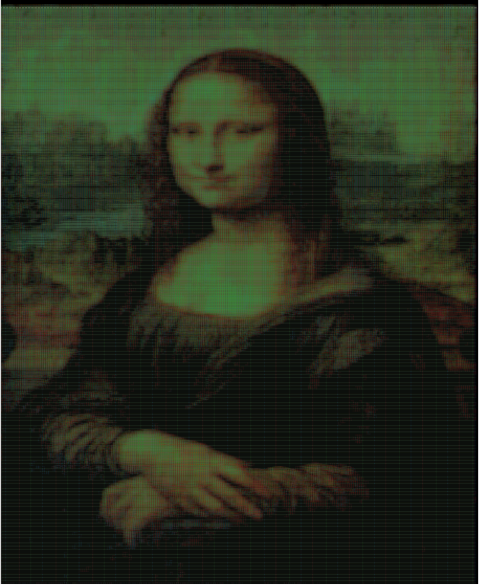
After converting the image into data and placing only one of the RGB values on color, you get this beautiful black and white version of the Mona Lisa:
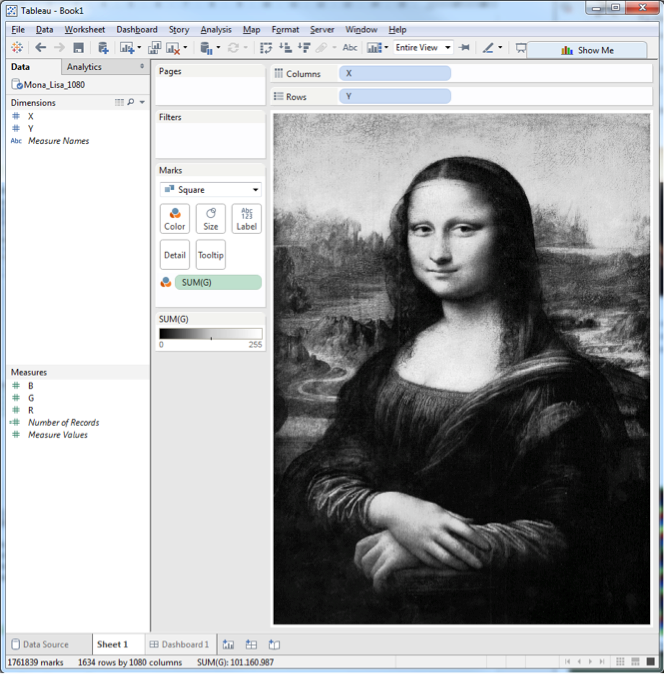
As you can see, we are visualizing more than 1.7 million marks in a single view!
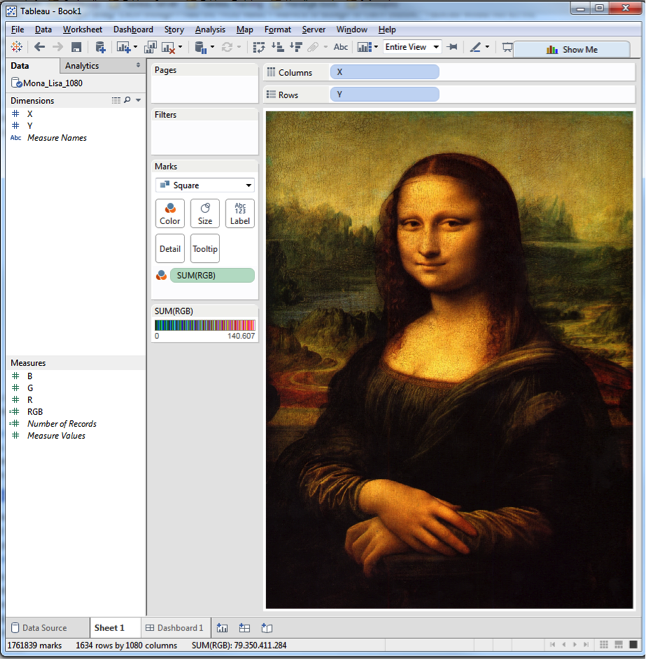
The next step was coloring this painting. We tried different techniques. The first one is based on a traditional PC monitor. Tableau only has space for one measure on the color, so we had to work with some kind of color intensity. So we pivoted the data to create a single measure. We put the Colour dimension on color and Intensity on size.
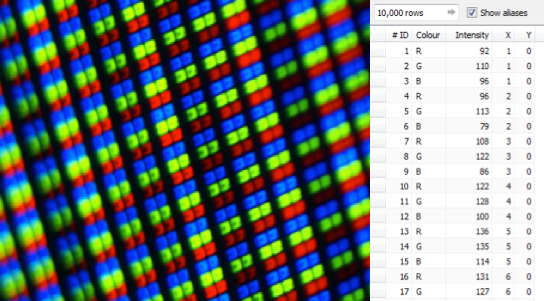
By doing this, you introduce color:
Since there is not a Marks card for intensity (yet?), we had to find another method to convert RGB to one measure. Tableau can make use of hexadecimal color palette, a method to store color information in one single measure = plan B! The hexadecimal color palette exists out of 255^3 colors so you will need a big color palette. A Google search led me to this Reddit post, which helped me create the RGB calculation and let me download the complete hexadecimal preferences.tps!
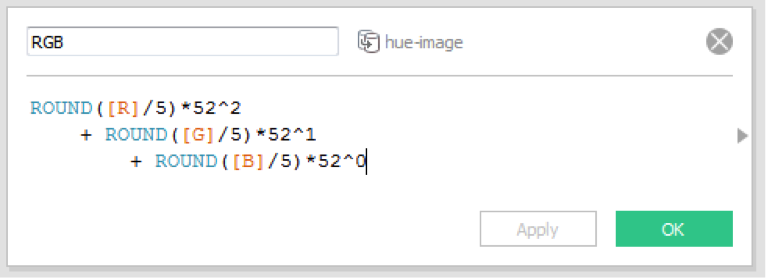
The result is stunning:
4. Advanced Photoshop Functionalities
After I solved the color challenge, my mind really exploded. Photoshop in Tableau was becoming more achievable! We identified the functionalities we knew we wanted: lightness slider, saturation slider, hue slider, color inverter, filters, effects, image rotator, image cropper, image flipper, switch between original and edited image, edited image exporter.
4.1 RGB to HSL, and Vice Versa
Let’s talk about color. Saturation is a term commonly used by imaging experts. It defines a range between 100% and 0% where 100% is a pure color and 0% a grey color. A pure color is a fully saturated color and is on the exterior of the color cylinder (seen below). Hue defines pure color in terms of green, red, or magenta. Hue also defines mixtures of two pure colors, and ranges from 0 to 359 degrees. Lightness is the last color property. It ranges from 0% to 100% where 0% is dark and 100% fully illuminated. Together hue, saturation and lightness creates HSL (or HSV):
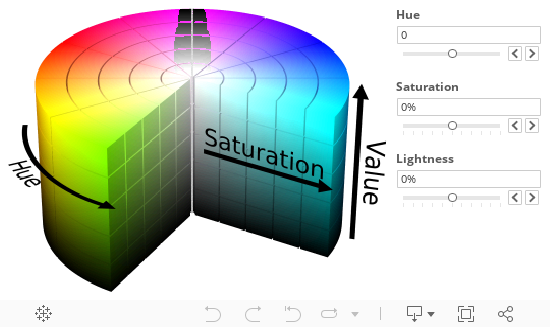
If you know the HSL values of a color you can calculate the RGB colors, and vica versa. This creates the possibility of manipulating the input RGB colors. So I searched the web for the correct HSL and RGB calculations, and found an HSL-to-RGB converter and a RGB-to-HSL converter.
4.2 Flip, Rotate, and Crop
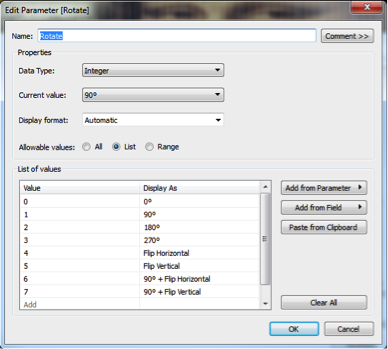
The last part of the project dealt with the nice-to-have features. I wanted to be able to flip, rotate, and crop the image. Rotating and flipping the image can be done in a simple calculated field. I tackled this with a parameter:
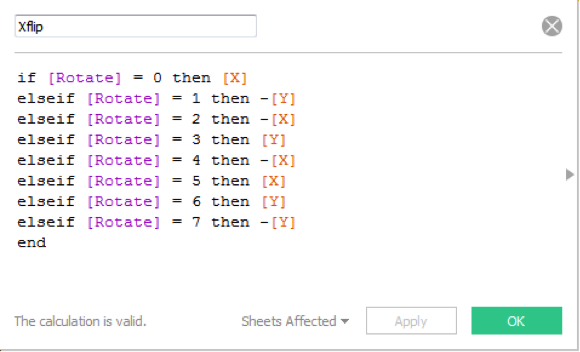
For the X, we made the following calculated field:
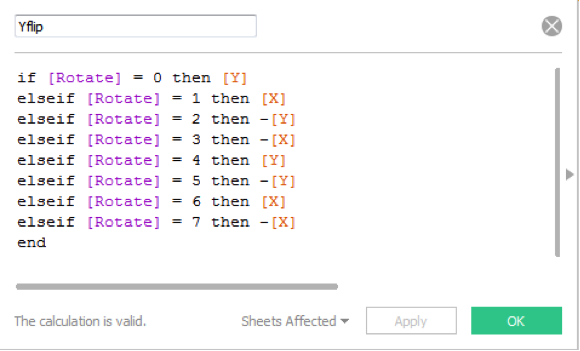
And for the Y, we made this calculated field:
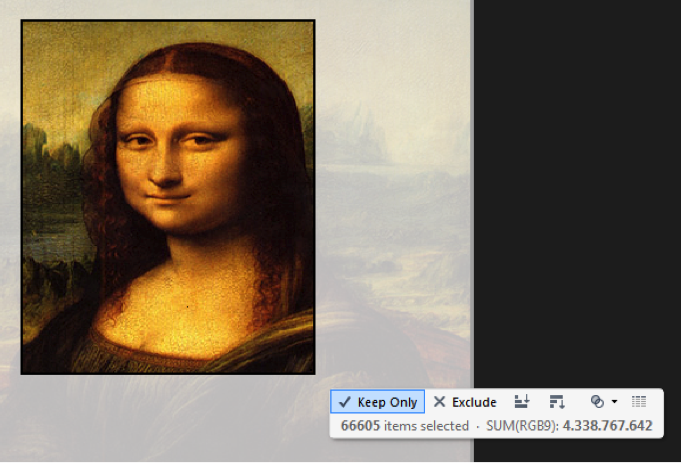
Cropping in Tableau is really easy, and you can do this by using the Keep Only feature:
4.3 Other Functionalities
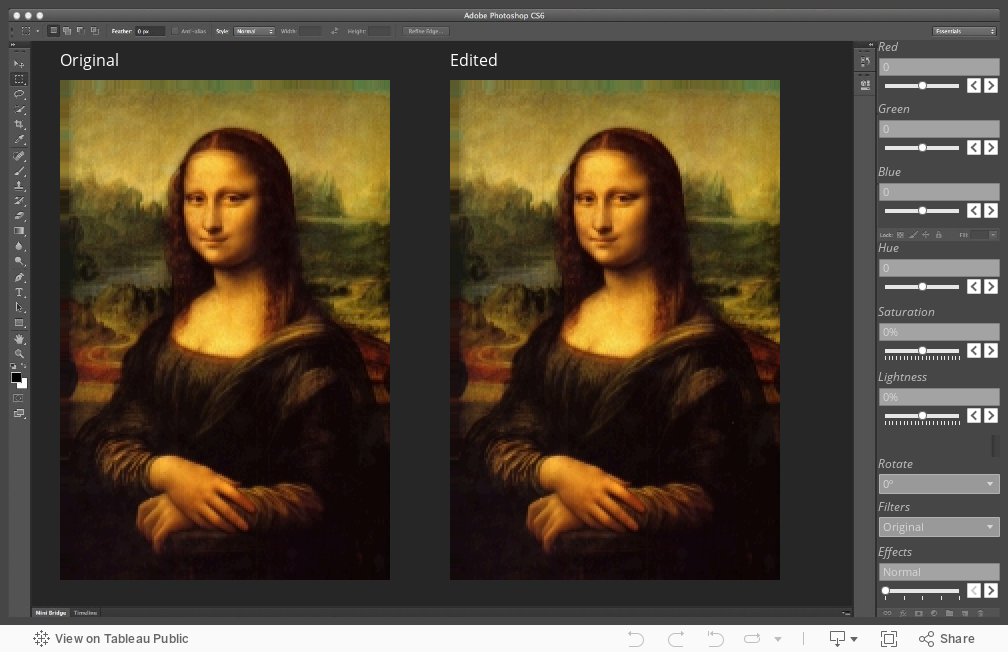
To really push the effects, I made a screenshot of Photoshop and put all the parameters and filters on the right side where Photoshop’s functionalities normally appear. The sheet is floating over the screenshot to maximize the effect. I also added some filters and effects, like sepia and black-white. You should definitely try the smileyface effect (after you select the effect, try clicking on a few pixels to see it in action).
5. The Finished Work of Art
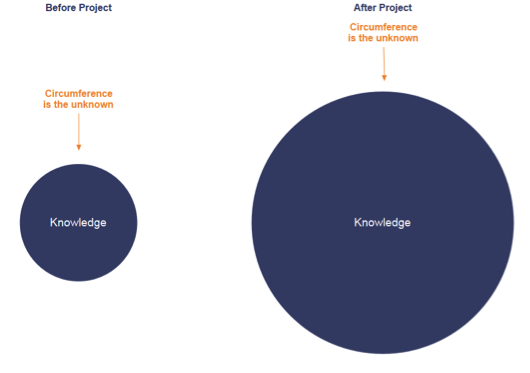
So did I learn about the unknown? My physics teacher taught me the following metaphor:
“Everyone has a circle of knowledge. The surface of the circle is the amount of knowledge and the circumference are the things you don’t know. By increasing your knowledge, you increase the surface of the circle but also the circumference which generates more questions.”
We proved that Tableau can handle tremendous amounts of marks within a single view. We proved that Tableau has no limits regarding calculated fields, and Tableau is powerful enough to do millions of calculations. We also learned a lot about color physics.
The result is a beautiful and crazy dashboard which probably consumes all Tableau Public’s internal memory on the server, but what the heck, here it is!
I hope this has inspired you! If you’d like to see more of my work, keep an eye on my Tableau Public account. And check out my Solar System Viz of the Day and my video on the Natural Query Language.