Using Tableau to Visualize Company-wide Management Data as a Part of DX Promotion
Accelerating data use
Utilizing various types of data in combination
Background to deployment
In August of 2003, Konica Minolta Holdings, Inc. is established by integrating the management of Konica Corporation (established in 1873) and Minolta Co., Ltd. (established in 1928). The years that followed can be said to be ones of change. In 2006, they withdrew from their respective founding businesses, the photo and camera, and drastically altered its business structure. In 2013, the holding company absorbed the seven operating companies, and became Konica Minolta, Inc. Konica Minolta is now expanding its digital workplace, professional printing, healthcare, and industry businesses. More than 40 thousand employees in approximately 150 countries work in these businesses.
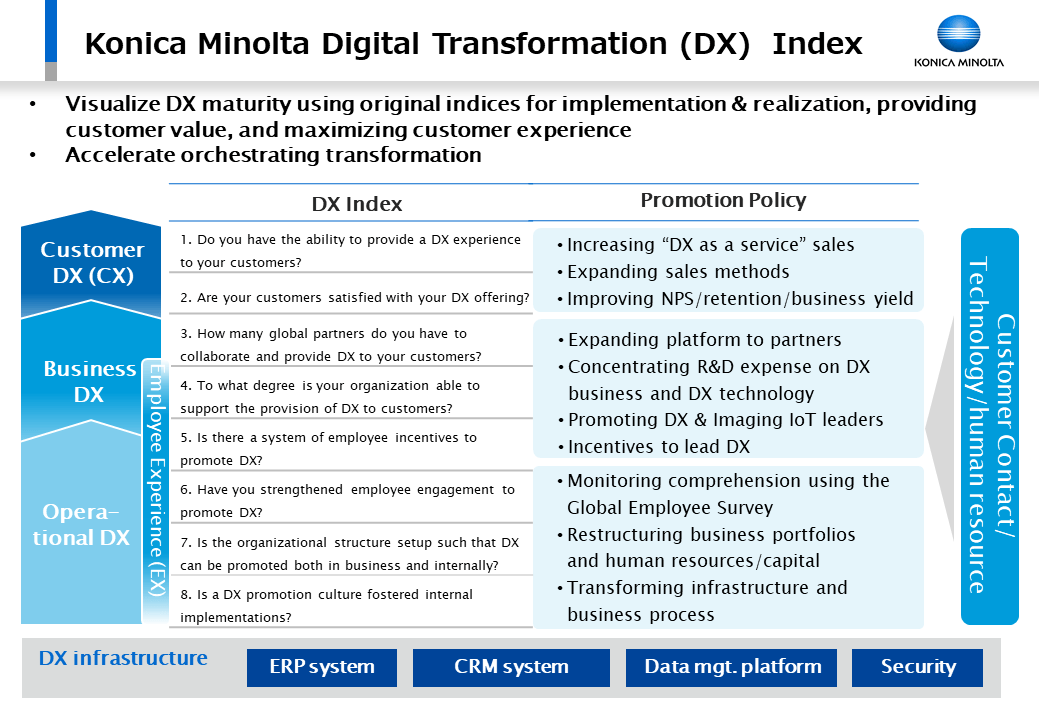
The company is also actively engaged in DX. In 2018, Konica Minolta established its Business Process Transformation Division, using digital technology to transform business processes. Moreover, beginning in 2020 and based on its "DX2022" medium-term business strategy, the company will transform its business model from a product-centric business to one focused on high-value-added businesses through DX. Konica Minolta's DX efforts have been well received externally, and the company has also been selected for the "DX Companies 2020" by the Ministry of Economy, Trade and Industry (Japan).
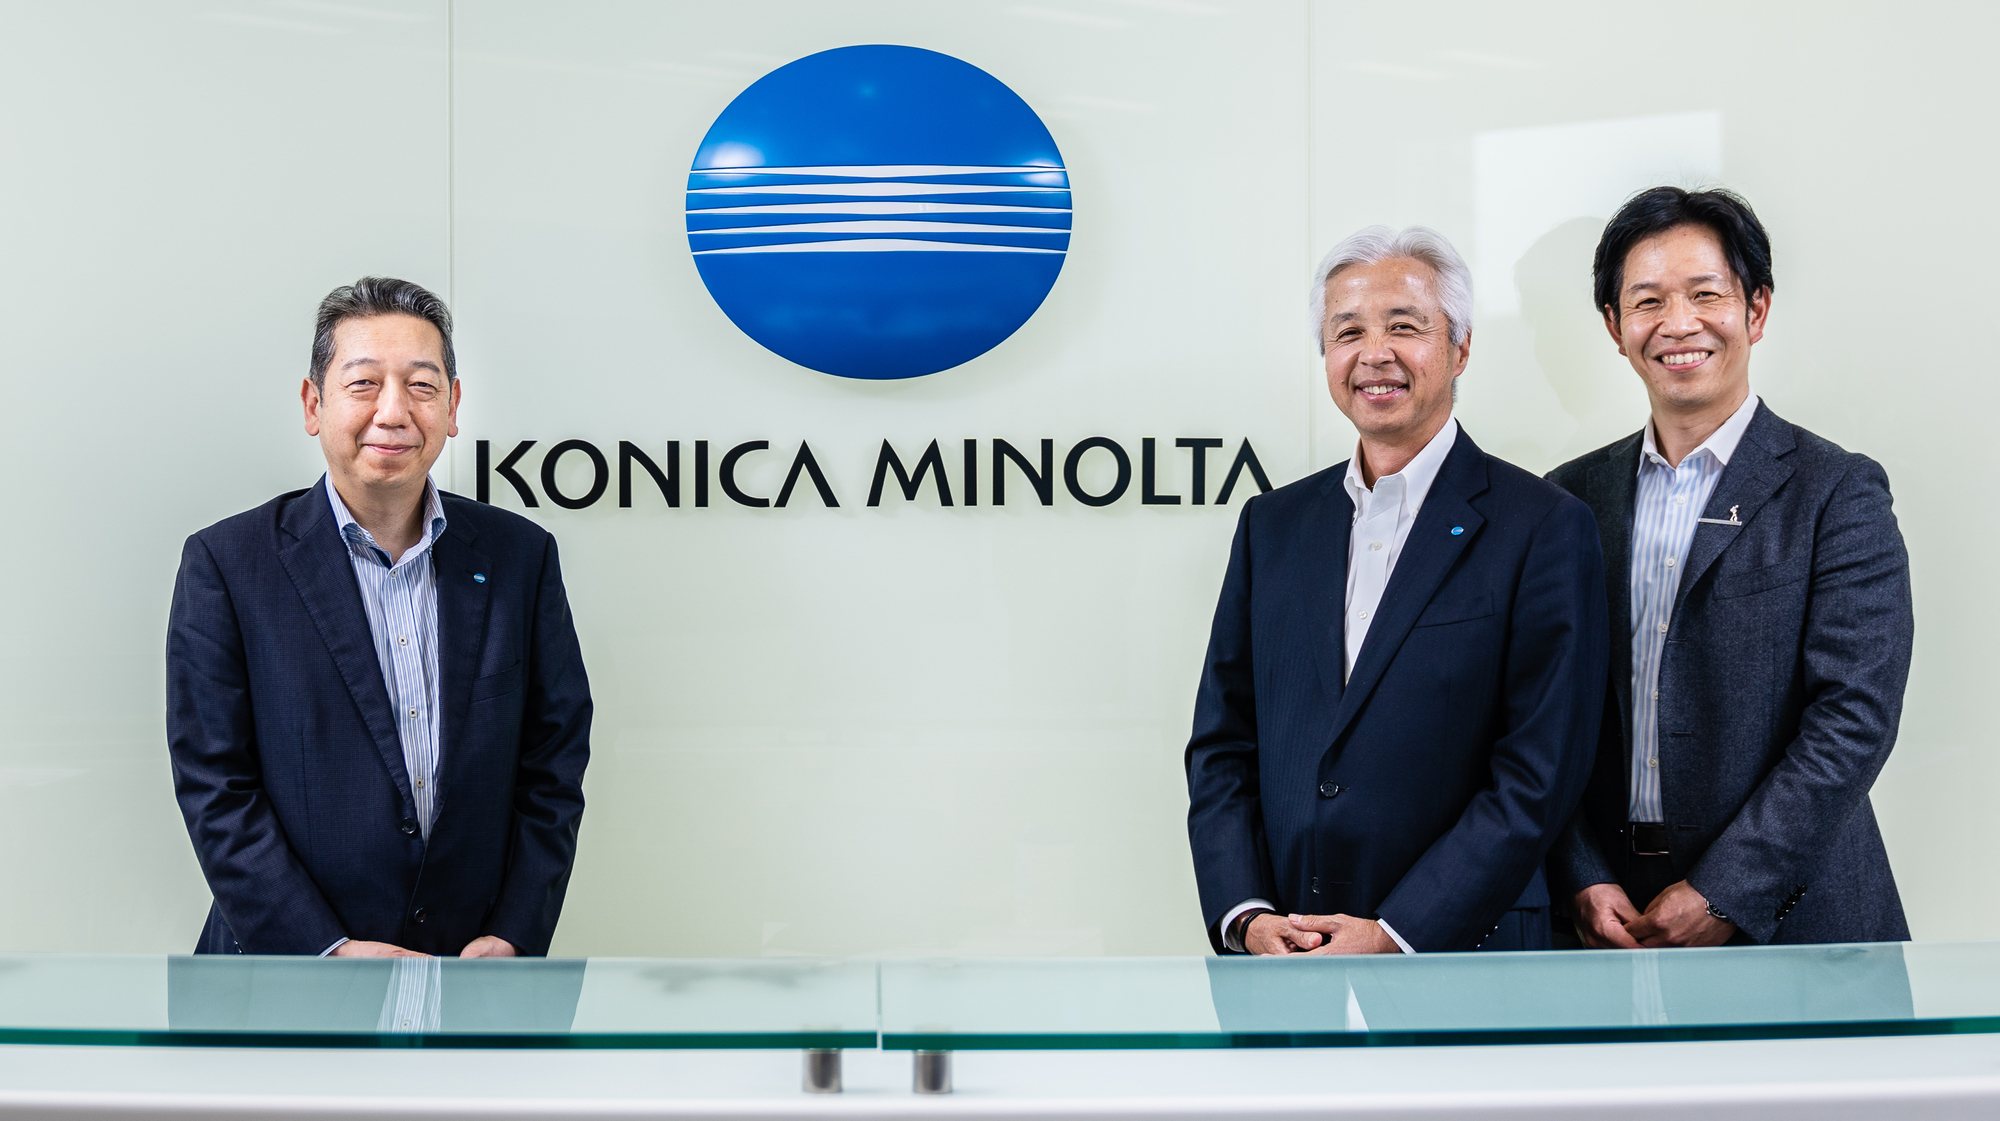
"Our goals for DX are to provide sustainable value by looking at possible future social issues for 2030 and working back from there to define customer values, which we then use as a starting point to strengthen our intangible assets and enhance the competitive strength of our business," explains Yuji Ichimura, who, as an executive officer and CIO/CSO at Konica Minolta, is responsible for Digital Transformation, DX Brand Communication and Public Relations. He states that in order to do this, Konica Minolta is using a raft of technologies and business models to transform the entire group. "We are willing to do away with existing organizations and processes and rebuild from scratch."
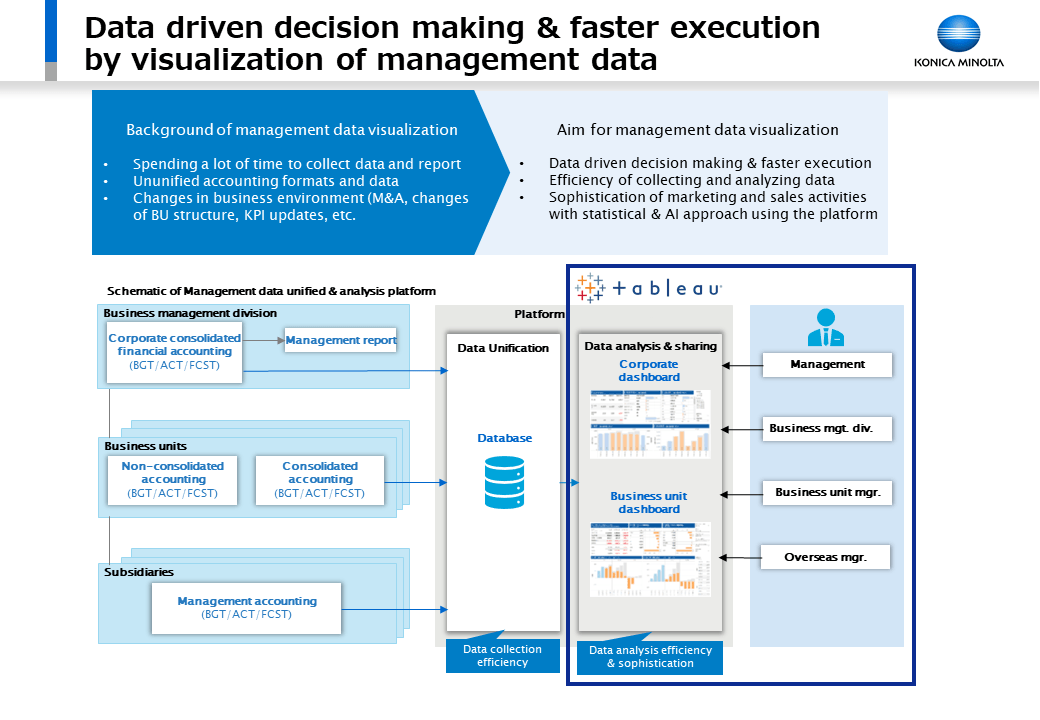
One of these efforts is the "visualization" of management data.
"We used to rely principally on Excel to collect and analyze management data, and doing so required an enormous amount of work," recalls Yukihiro Imaizumi, group leader of the Transformation Promotion Department at Konica Minolta's Business Process Transformation Division. He says that creating documents for management meetings took several days. "Because of that, data would already be out of date when we held our management meetings and making decisions in a timely manner was difficult." Ichimura also points out that "By the time we received such data, the situation on the ground had already changed." He says that they would regularly issue instructions to the field based on old data, ultimately resulting in confusion.
We want to create a framework connecting data analysis to decision-making and execution in a straightforward, consistent manner. We also believe that being able to share the meaning of our figures and discuss them on the same basis is important.

Tableau deployment / operating environment
Tableau is used to resolve these issues. It has become the standard data platform for the entire company, and activities to support its use are actively underway. As Tetsu Hosoki explains, "Our standard approach is to hear the needs of the business divisions, offer a methodology suited to each, and then have each division actually use the data."
Additionally, they actively cooperate with the division responsible for internal communications. Information on the use of Tableau has also been published in a series of in-house DX case studies authored by this division. "We are expanding the use of Tableau through an optimal combination of top-down and bottom-up approaches," says Imaizumi.
Activities such as these have borne fruit, with more than 500 people from each business unit participating in an internal Tableau-related event held in December 2020. Hundreds of dashboards have already been created.
Reasons for selecting Tableau
Imaizumi and Hosoki explain that Tableau was selected as a standard data platform for three major reasons. The first is that it allows detailed data analyses to be performed with ease. The second is its high level of connectivity, which allows flexible data ingestion. The third is the comprehensive level of support aimed at gaining Tableau traction.
Moreover, the 2020 announcement of plans to integrate with the “Einstein Discovery" (now CRM Analytics) AI functionality offered by Salesforce also served to encourage this decision, and the company anticipates that this will further accelerate the use of data.
Creative time has increased. We spend much less time thinking about how to analyze and present the data, and more examining what knowledge and insights it can provide.

Effects of deploying Tableau
Using Tableau has the following effects
Accelerating data use
Tableau lets users cut down on the time required for data collection, analysis, and reporting, allowing timely use of data. "Documents that used to take three days to put together can now be created in a matter of hours, and we can run our meetings from dashboards," says Imaizumi.
Utilizing various types of data in combination
Importing and combining different types of data in Tableau has also simplified analysis tasks that had previously been difficult. One example given is the analysis of the correlation between the spread of the COVID-19 crisis and sales. The company is analyzing regional trends in work-related injuries, performing factorial analysis and more.
We were impressed by how clever Tableau is. The design really seems to have been carefully thought out to fulfill the needs of data analysts. We also like the fact that we can create dashboards in a limited amount of time and amend them on the spot.

Future developments
Going forward, Konica Minolta plans to build further on best practices for using Tableau and will proactively deploy and utilize "Einstein Discovery." In September 2020, the Business Process Transformation Division started using Einstein Discovery and began deployment to improve sales productivity in key businesses. In 2021, the knowledge gained through these processes will be used to offer proposals to other business units in turn.
Ichimura notes that "Japanese companies have the advantage of being able to share tacit knowledge easily, and we anticipate that combining this with the power offered by data will allow us to demonstrate even greater strength." He explains that the visualization of management data is a powerful platform for sharing with actual workplaces the tacit knowledge that is the decision-making criteria used by managers, in a supportive manner. "If we can achieve that, people in the field will be able to make the same decisions as those in management roles." The Japanese companies which are able to do this are also sure to be highly competitive in a global setting.