Working with External Services in Tableau: Python, R, and MATLAB


When you convert your Python, R or Matlab scripts to run in Tableau, you open up a world of new opportunities and democratize data science by making advanced algorithms accessible to everyone in your organization with a simple drag and drop. It also allows your teams to see, understand, and explore the results of your script in a visual, interactive format.
To successfully use Tableau’s external services connector, there is one very important building block that you need to understand and that’s table calculations!
When using Tableau's external services, all values are passed and returned via table calculations, this means that how the view is constructed will affect how values are sent to the external service. In this blog post, we’ll help you understand Tableau table calculations so that you can use them to your advantage when calling out to an external service and ensure that your resulting visualizations are optimized for performance.
If you’re already familiar with table calculations, skip ahead to learn how they translate to external services.
Table calculation basics
Table calculations perform computations on the aggregate data in your visualization. This isn’t a row level calculation, but rather something that is computed on the fly on your viz.
A benefit of table calculations is that they allow you to answer different questions of your data, simply by adjusting their computation in Tableau.
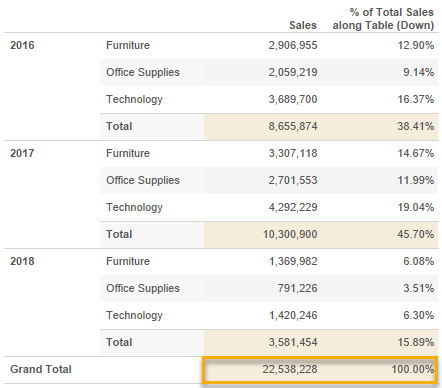
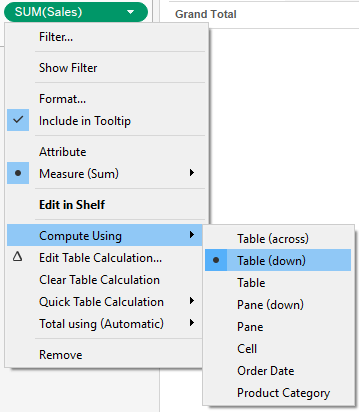
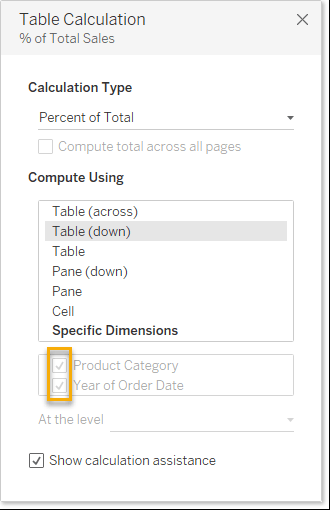
Let's look at Percent of Total as an example. Let’s say you want to analyze your sales over the last three years to understand how each category contributed to your overall sales. Compute your calculation across the whole table, described in Tableau as Table (down).
Notice we have our 100% of total at the very bottom. Each of the year + category combination contributes to that total 100%.
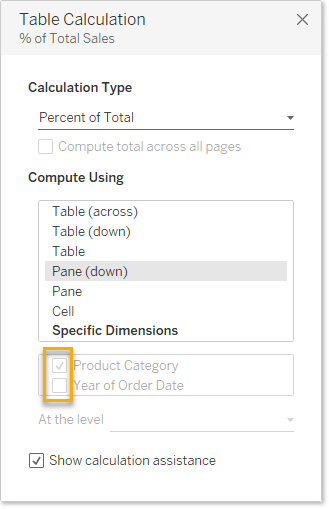
Alternatively, you can analyze the percentage of sales that come from each category within each of the years by computing the calculation within each pane. In Tableau, this is described as Pane (down). Notice that we now have a 100% total within each pane:
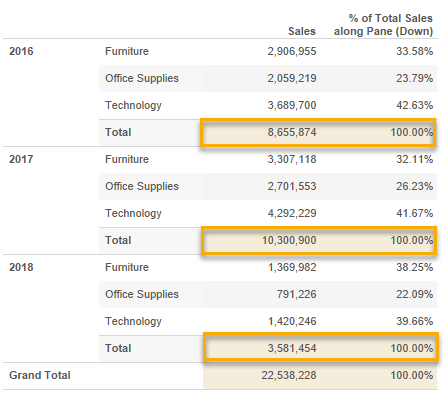
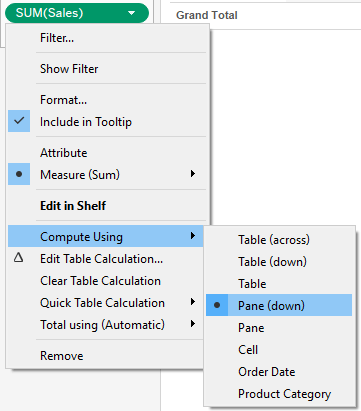
Table calculations that address multiple dimensions
Now you've got the basics, let's take this to the next level.
When you have multiple dimensions in your view and you want to be more specific on how a calculation is computed, just right click on the pill in the view and select edit to open the table calculation dialog box.
Let revisit the examples above and see how they translate to this new dialog. In the first example we wanted to address both the category and the year in which a sale was made.
You can do this by ticking both dimensions in the dialog box. We're not partitioning our calculation at all—we are just telling Tableau to address everything in the view.

For comparison, in the Pane (down) example, we analyzed the percentage of sales that come from each category within each of the years. Since we only want the calculation to address the product category, we want the calculation to restart each time the order date changes. By not ticking the Year of Order Date dimension in the dialog, we’re telling Tableau that this is how we want to partition our data:

How does this translate to external services?
Tableau makes a separate call to the external service for each partition in your table calculation, so when the partitioning field is very granular, it can result in thousands of server calls. This can drastically hinder performance.
To solve this in most use cases, it makes sense to put all fields in the addressing section by checking all the boxes under specific dimensions in the edit table calculation dialog. This will result in only a single call to the external service. The exception to this is when you want to break up the view to answer a specific question.
Let's take a look at some examples using Tableau’s TabPy External Service connector:
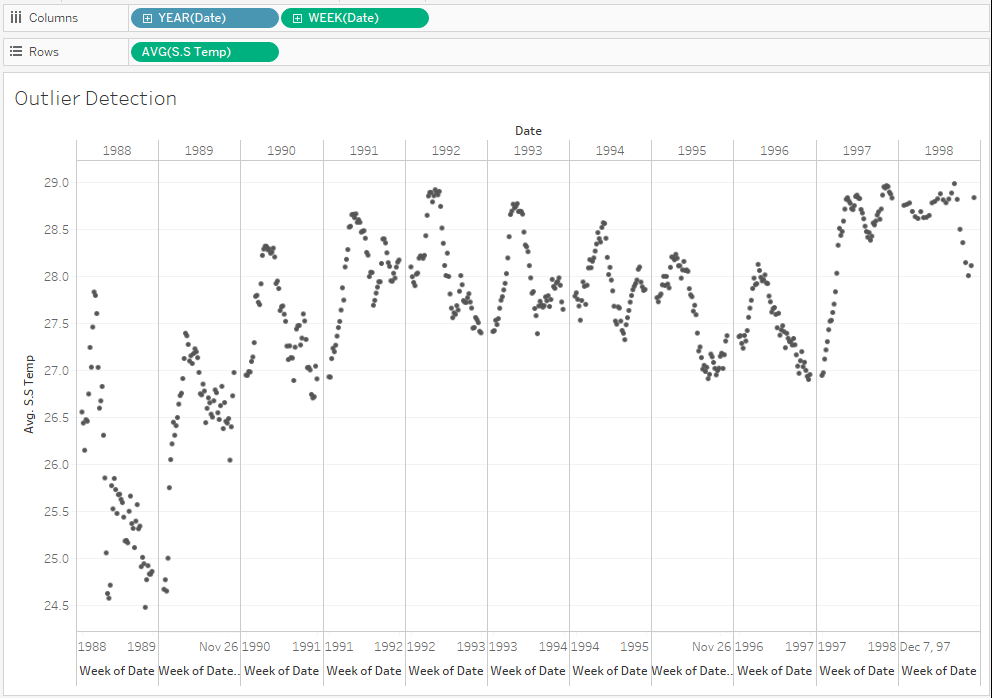
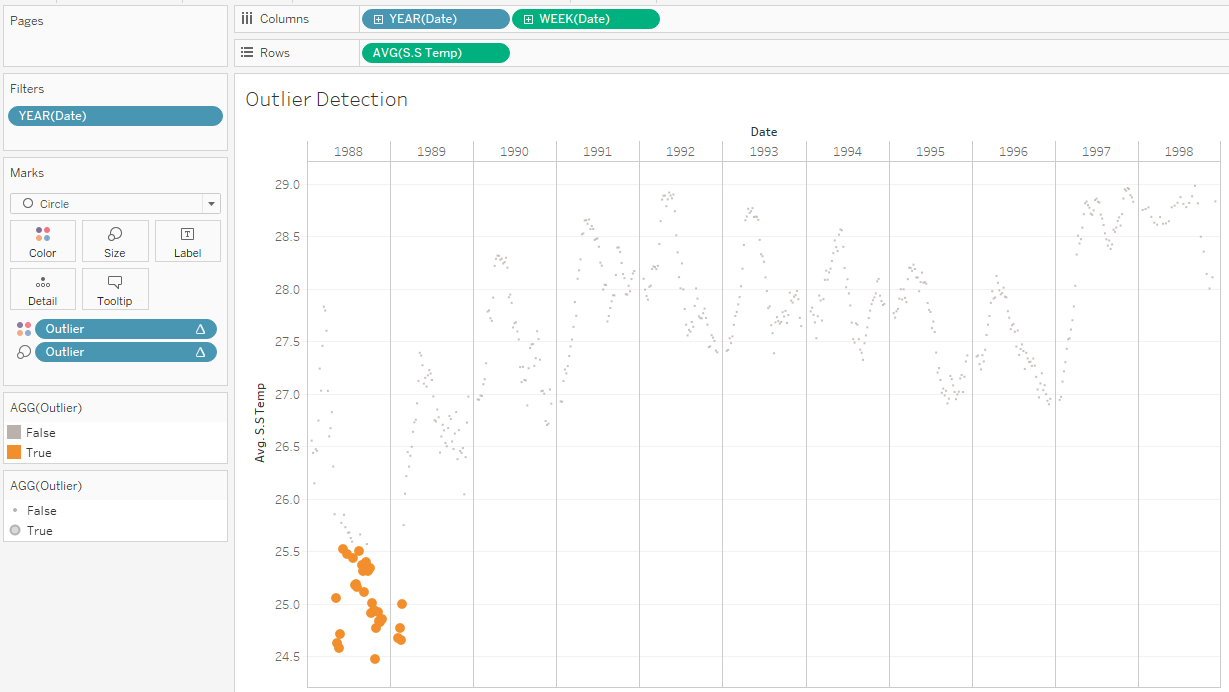
I have 11 years of sea surface temperature data, aggregated at a weekly level, resulting in a total of 556 marks on the view:
To identify the outliers in this dataset, you can use a simple Python script to call out to TabPy and check whether a given data point is outside of the inter quartile range of the total dataset. If so, we can classify it as an outlier.
Within this script there are also some print statements to print the response in the command line running TabPy:
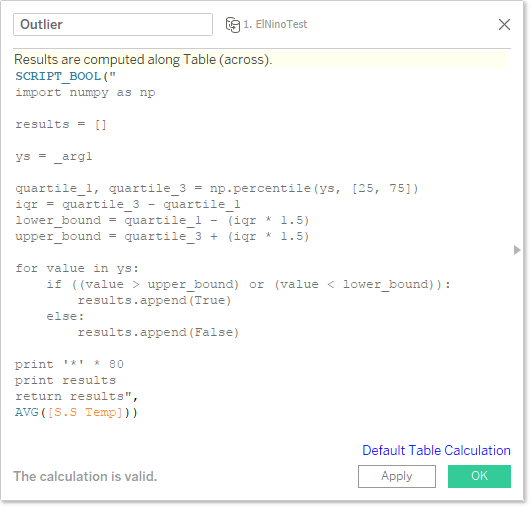
Since this pill is a table calculation, we have to define how it’s computed when we add it to the view.
If we compute Table (across), this will send all the 556 values in one single call to the server, allowing us to evaluate the question, “what are the outliers within this whole dataset?”
We can see outliers in 1988 and 1989 shown by the larger orange points:
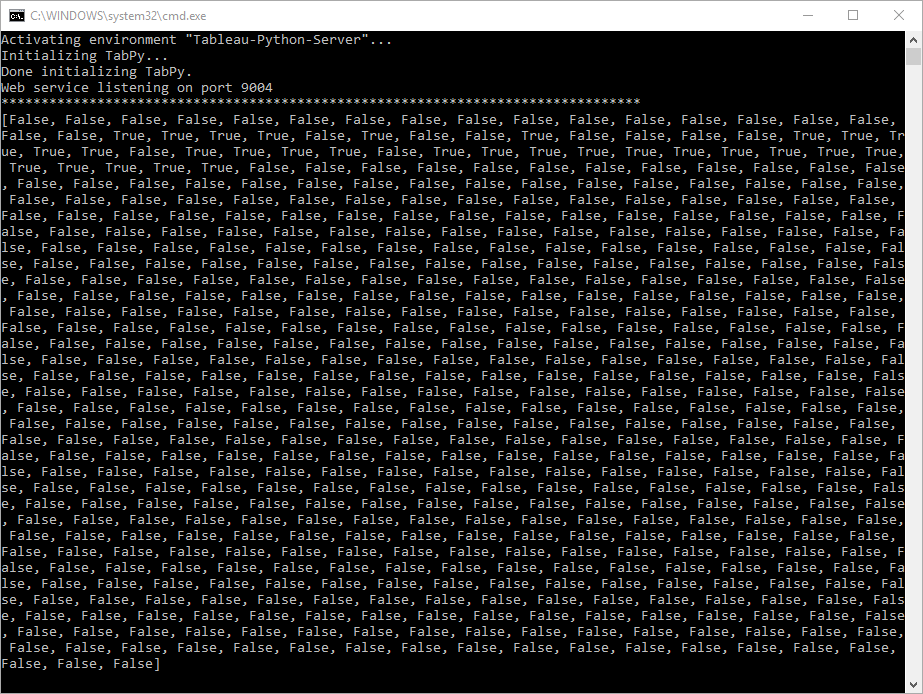
Let’s take a look and see what response our print statement gives in the command line:
First we see a row of 80 stars and then the response that’s sent back to Tableau, which is a single array of 556 Boolean values of either TRUE or FALSE.
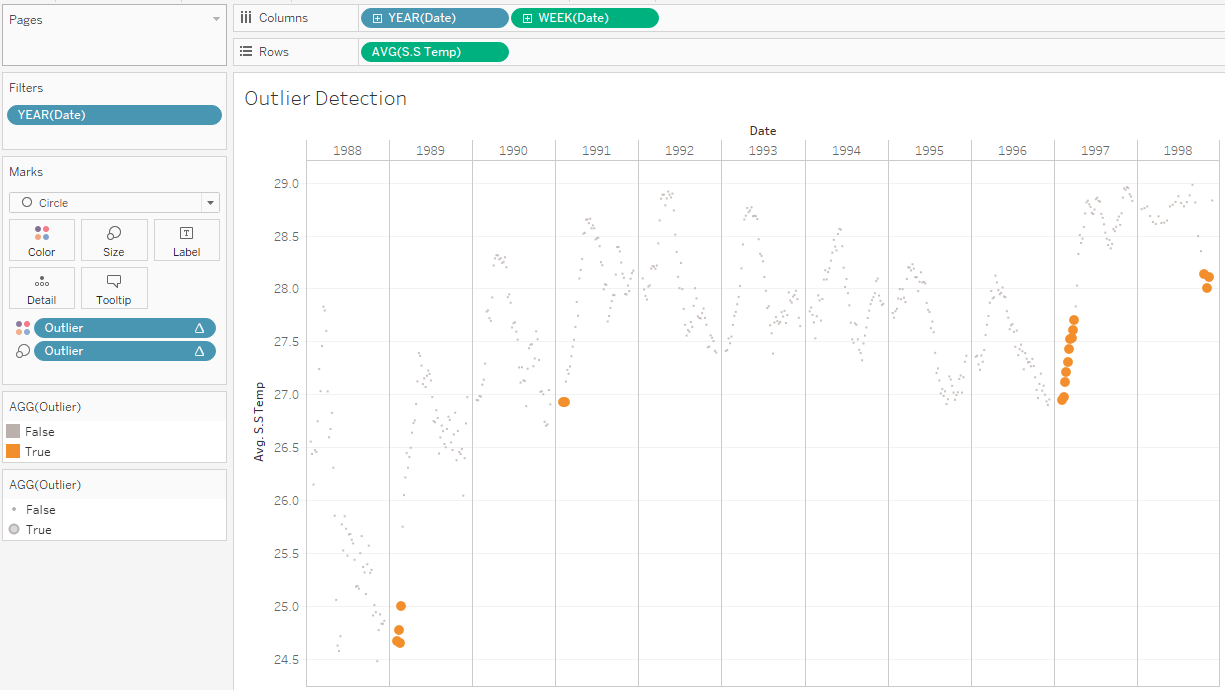
But what if the business question changes? What if we want to see the outliers within each year? Changing the table calculation to compute Pane (across) will result in 11 separate calls to TabPy—a separate call for each partition, which in this case, is each year. TabPy will then find outliers within each subset of data and give the Boolean response accordingly.
We can now see that there are outliers in 1989, 1991, 1997 and 1998. The data shown by larger orange points here are outliers within their subset of data:
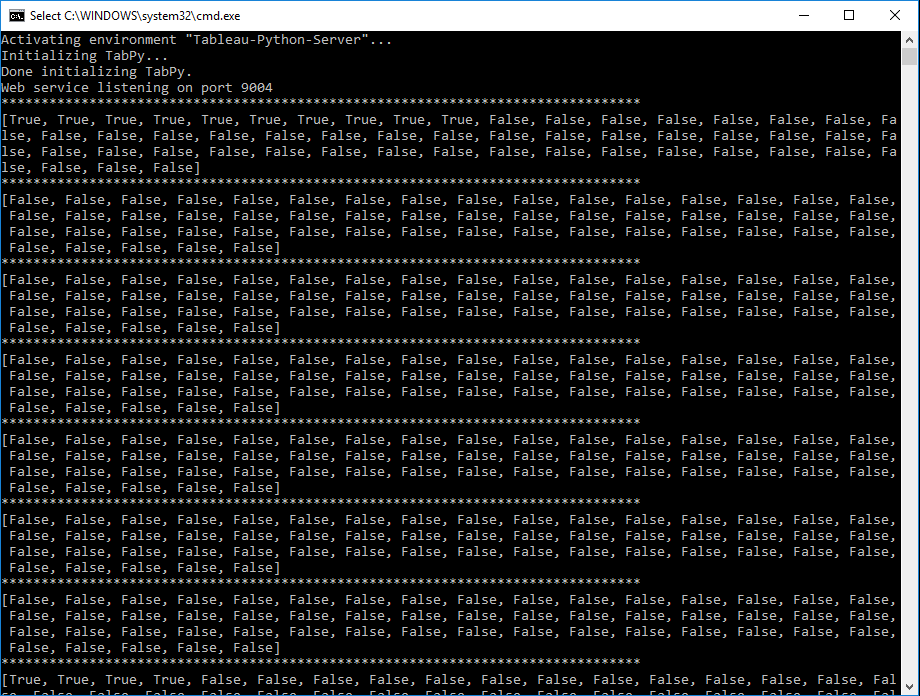
We can see this in the command line too where you can see the stars printed at the beginning of each call to the TabPy server:
Now that you understand the concepts of table calculations, you can utilize them to your advantage when running your scripts in Tableau. They empower you to take advantage of all the benefits that comes with using the external services connector and most importantly, enable you to have fun pushing the boundaries of advanced analytics!
Learn more about data science integrations in Tableau. Or check out these resources:
- Read this post on how to build advanced analytics applications with TabPy.
- Read this post on to put your MATLAB models and algorithms to work in Tableau.
- Learn how to configure R and Rserve for use with Tableau.
Storie correlate

VizQL Data Service from Tableau: Use Your Data, Your Way
 8 Agosto, 2024

When and How to Use Multi-fact Relationships in Tableau
 1 Agosto, 2024

Top data books of 2021
 12 Dicembre, 2021