Tutte le storie di Visualizations
 Visualizations
Tableau Confessions: You Can Move Labels? Wow!
 28 Gennaio, 2016
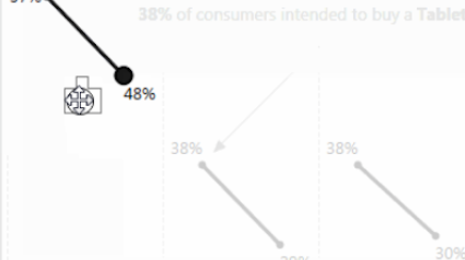
I was on a call with Zen Masters Steve Wexler, Jeff Shaffer, and Robert Rouse. We were talking about formatting labels, and Robert was saying, “Well, of course, you can just drag the labels around.” “Wait. What?” I said.
28 Gennaio, 2016
I was on a call with Zen Masters Steve Wexler, Jeff Shaffer, and Robert Rouse. We were talking about formatting labels, and Robert was saying, “Well, of course, you can just drag the labels around.” “Wait. What?” I said. Visualizations
Data Dialogues: To Optimize or to Satisfice When Visualizing Data?
 22 Gennaio, 2016
Is there a single “best” way to visualize data in a particular scenario and for a particular audience, or are there multiple “good enough” ways? This is going to sound strange, but I think both are right.
22 Gennaio, 2016
Is there a single “best” way to visualize data in a particular scenario and for a particular audience, or are there multiple “good enough” ways? This is going to sound strange, but I think both are right. Visualizations
6 tips to make your dashboards more performant
 15 Gennaio, 2016
We here at Tableau are very proud of how easy it is to see and understand data with Tableau. Once you get started, it’s intuitive to dive deeper by adding more and more fields, formulae, and calculations to a simple visualization—until it becomes slower and slower to render. In a world where two-second response times can lose an audience, performance is crucial. Here are some tips on making your dashboards more performant.
 Visualizations
LODs of Fun with Jedi Filters
Tableau is a playground for creativity. When a bit of knowledge meets imagination, a Tableau Jedi is born. Understanding a couple of key facts about Level of Detail Expressions can save you hours of trying to guess Google search terms for answers to tough questions.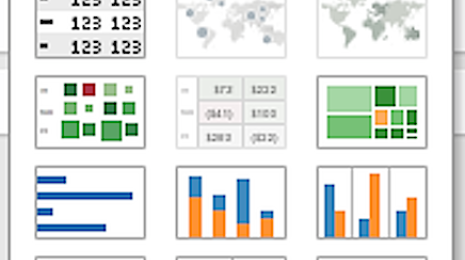 Visualizations
Unbend Your Mind for Visual Analysis
Blank stares, then...huh? That's what I get when I say "visual analysis." People tend to think I'm talking about making a chart. I am, but more than that, I'm talking about exploring data visually with Tableau.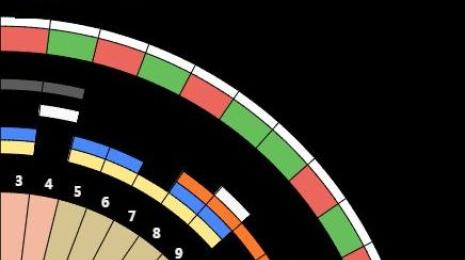 Visualizations
Star Wars: The Vizzes Continue
 31 Dicembre, 2015
We’ve sure been having a geeky month here at Tableau. It all started when we built a Web Data Connector (WDC) to the Star Wars API. Then, we watched as you, our downright-stellar community, put our data to work. (We couldn’t resist that pun.) The Star Wars data fever didn’t end there, though. In the nearly two weeks since Episode VII’s release, dozens of visualizations have popped up all over the web. Here are some of our favorites.
31 Dicembre, 2015
We’ve sure been having a geeky month here at Tableau. It all started when we built a Web Data Connector (WDC) to the Star Wars API. Then, we watched as you, our downright-stellar community, put our data to work. (We couldn’t resist that pun.) The Star Wars data fever didn’t end there, though. In the nearly two weeks since Episode VII’s release, dozens of visualizations have popped up all over the web. Here are some of our favorites.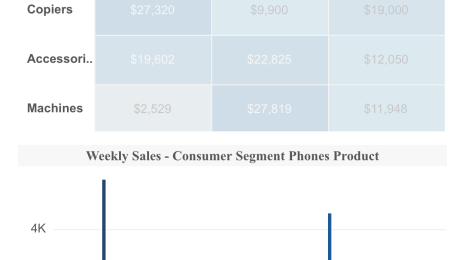 Visualizations
Mobile dashboard design: Less is more on the small screen
 30 Dicembre, 2015
So you have your focus and your orientation. Now it’s time to design your mobile dashboard. Keep your dashboard design simple and targeted. Follow these tips to design a new dashboard or transform an existing dashboard for the small screen.
30 Dicembre, 2015
So you have your focus and your orientation. Now it’s time to design your mobile dashboard. Keep your dashboard design simple and targeted. Follow these tips to design a new dashboard or transform an existing dashboard for the small screen.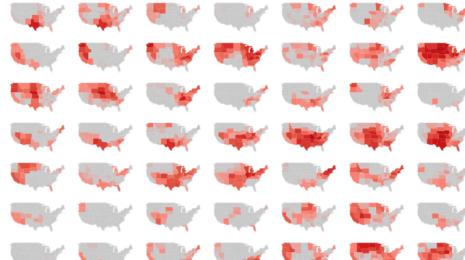 Visualizations
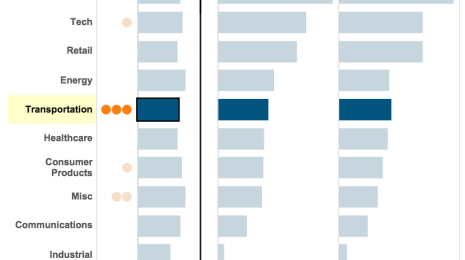
Fit the Chart to the Story, Not the Data
24 Dicembre, 2015
Just because you have geographical data, it doesn't mean you should make a map. Just because you have a date, it doesn't mean a trend line is the best thing. And just because you want to see the relationship of a part to a whole, it doesn't mean you should use a pie chart. Visualizations
Mobile dashboard design: Choose your orientation
23 Dicembre, 2015
Now that you’ve picked the metrics to include in your mobile dashboard, it’s time to decide whether to go vertical or horizontal. It’s important to make this decision before you start building your dashboard or transforming an existing one. Why? The answer is simple: screen size. Because the phone screen is very small, the orientation you choose will impact many steps, from your analysis to the layout of your views. Below are some tips to get you started.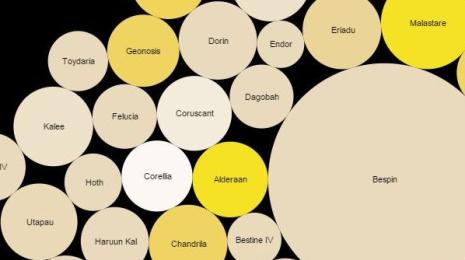 Visualizations
The Force Awakens: Our Favorite Visualizations
18 Dicembre, 2015
Last week, we released a web data connector (WDC) to the Star Wars API. Judging from your Twitter conversations, we can tell there’s a lot of Star Wars excitement in the Tableau community! Today, we’d like to congratulate the fans (ourselves included) for enduring the long wait for Episode VII. We’re excited to share ten awesome visualizations about Star Wars, including many that you created with the WDC in just the past week. Visualizations
Mobile dashboard design: Start with your focus
16 Dicembre, 2015
With mobile devices now ubiquitous, more and more companies are looking to leverage the power of mobile analytics. Whether you’re at an offsite meeting, on a plane, or even in your pajamas at home, being just a few taps and swipes away from your data has tremendous value. But due to their small screen size and touch interface, phones pose a unique challenge as an analytics distribution platform. That’s why it’s critical to pinpoint your analytical focus when designing your smartphone dashboard. You’ll want to include only the metrics that truly matter to your audience. Visualizations
Data Geeks, Visualize Our Star Wars Data
11 Dicembre, 2015
Here at Tableau, we might be getting a little too excited about next week’s Star Wars release. But who can blame us? Star Wars basically has the perfect combination of brainy geekiness and excellent storytelling that we love here at Tableau.