Top 10 Qualifiers for Iron Viz 2026


Since 2011, Tableau has brought the world’s premier data visualization competition, Iron Viz, to Tableau Conference each year. The competition culminates in a thrilling 20-minute showdown where three finalists, using the same data set, craft their most compelling stories live on stage. The journey to the championship begins with a qualifier round, with all stages judged by the same set of criteria.(More on that below.) This event is unlike any other, celebrating data skills, data storytelling, and the power of the Tableau Community.
The Iron Viz 2026 Qualifier competition results are in, revealing this year’s finalists! The 2026 theme was food and drink. From local flavors to global trends, family recipes, regional cuisines, and hidden gems—the DataFam was challenged to viz what feeds their soul. The theme ignited a spark for many, inspiring 122 entrants—67% submitting visualizations for the first time.
Among the hundreds of entries, 10 visualizations impressed the judges’ and made it to the top 10. But three of these visualizations rose to the top of the list to advance to the Iron Viz Championship at Tableau Conference 2026 in San Diego, May 5-7.
How are the Iron Viz Qualifiers judged?
The judging panel—which is made up of Tableau Ambassadors, Visionaries, and former Iron Viz finalists—reviews all submissions, doing the difficult task of selecting the finalists, using the following criteria to score all entries:
- Design: How appropriate is the design for the story being told?
- Storytelling: Is a clear story being told or a question being explored, and is there appropriate context?
- Analysis: How sophisticated and appropriate is the data that is being used for the story?
Thank you to our community judges for dedicating their time and expertise: Agata Mężyńska, Alice McKnight, Brandon Ohlaug, Candice Munroe, Caroline Swiger,Celia Fryar, Charlotte Shearsby, CJ Mayes, Dan Chissick, Danny Bradley, Deborah Simmonds, Doc Kevin Lee Elder, Eman Alvani, Eric Balash, Fraser Gallop, James Emery, Jessica Moon, Jim Dehner, Kathryn McCrindle, Kyle Yetter, Lindsay Betzendahl, Matt Huff, Pat Sanger, Preethi L., Priya Padham, Rohit Prasad, Roshni Gohil, Sam Homier, Sarah Moore, Seulki Kang, Timothy Vermeiren, Tore Levinsen, Viraj Bhargave, Whitney Wood, Youssef Dawoud
Who did the judges determine created the top 10 vizzes?
It’s no secret that the Iron Viz Qualifier is a demanding challenge that tests entrants’ skills in every way through data sourcing and preparation, trying new features and techniques, data storytelling, and applying beautiful designs. Each submission is an achievement and we commend all applicants for their hard work in creating these visualizations. Explore the Iron Viz 2026 Entries.
Iron Viz 2026 finalists
These three visualizations rose to the top and their authors will advance to the Iron Viz Championship in May.
The Confection Connection
By Brian Moore
Boston, Massachusetts, United States
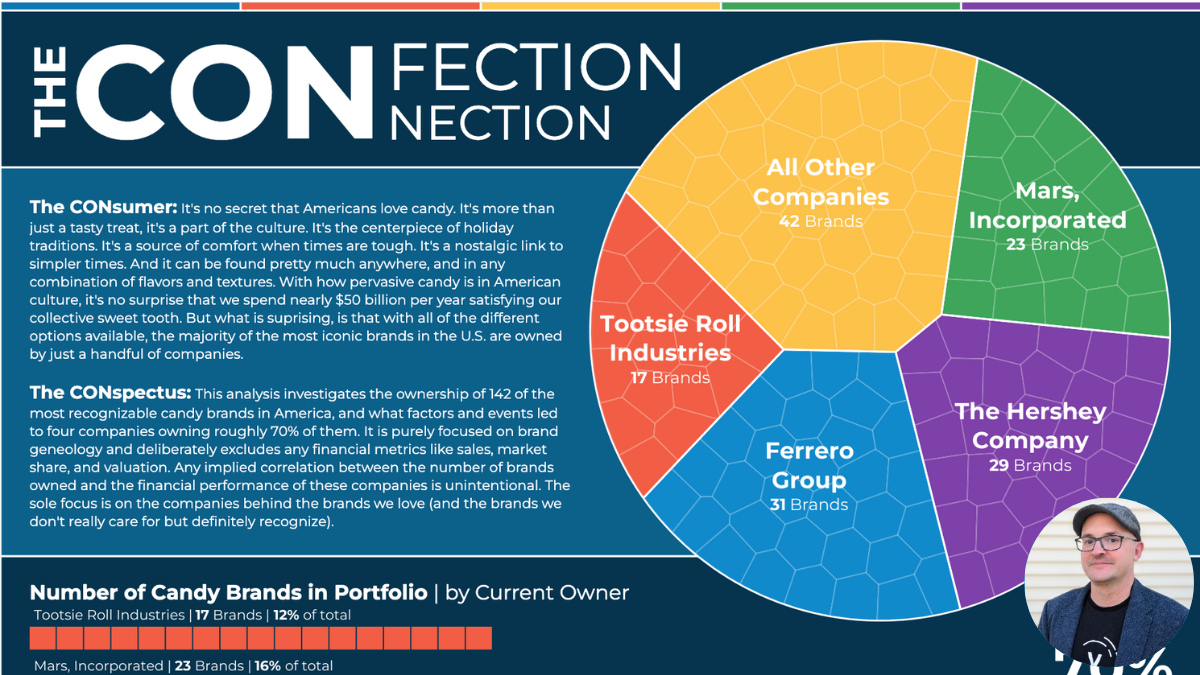
Brian Moore: I had built a Tableau Public viz on this same topic earlier in 2025. As I was researching and gathering data for that project, I became fascinated by the history of candy in America and ended up down a ton of different rabbit holes. When I was finished, I had a mountain of data and a thousand different stories I could tell. I built a viz called “Kings of Confection”, and although I was happy with the design, I was disappointed with the story. In hindsight, I wish I had focused more on the historical events and the economic and political conditions that led to the consolidation of the U.S. candy market, as that is what had really interested me during my research. When they announced the theme for this year’s qualifier, it was like I was given a second chance to tell this fascinating story.
Nutrition, Energy Sources, and Ingredients of Dim Sum
By Kevin Wee
Chicago, Illinois, United States
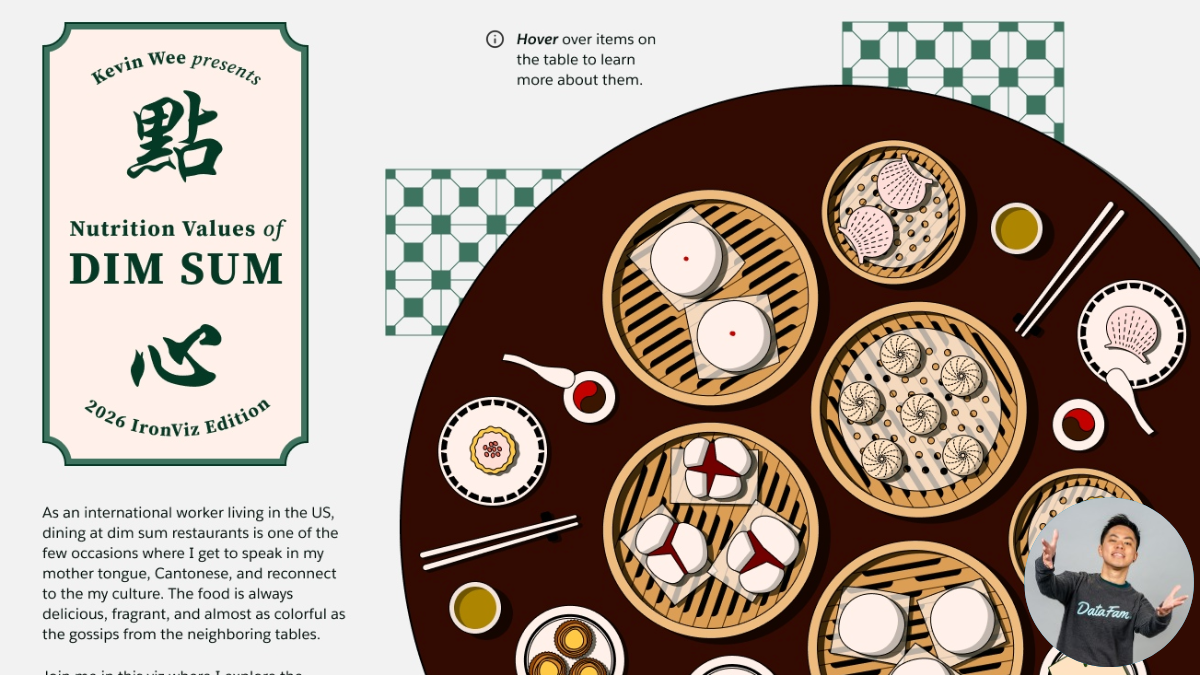
Kevin Wee: In 2024, I created a viz on the nutrition values of 30 well-known dim sum dishes based on a research paper published by the Hong Kong Center for Food Safety. Dim sum is the food of my culture as a Cantonese, and I'd like to share it with the data community in an infographic format. The viz was well received by the data visualization community. It was chosen by Tableau Public as the 2024 Chinese New Year Viz of the Day. Furthermore, it was featured in Andy Kirk's Data Visualization Handbook as an example of good DataViz design. The aforementioned research paper contains an in-depth analysis of 76 dishes, and I've always wanted to create another viz of them all. However, I have not found a suitable occasion to do so until I heard about this year's IronViz qualifier topic: Food and Beverage. So, I decided to kill two birds with one stone: Creating a new infographic about all these 76 dishes and submitting it for the qualifier contest. The design of my qualifier viz has been inspired by common visual elements in a Cantonese restaurant, e.g., lotus (a common food ingredient), sticky rice dumplings (tetrahedral shape), folding fans, and green tiles.
Packing For Mars
By Ann Pregler
Battle Ground, Washington, United States
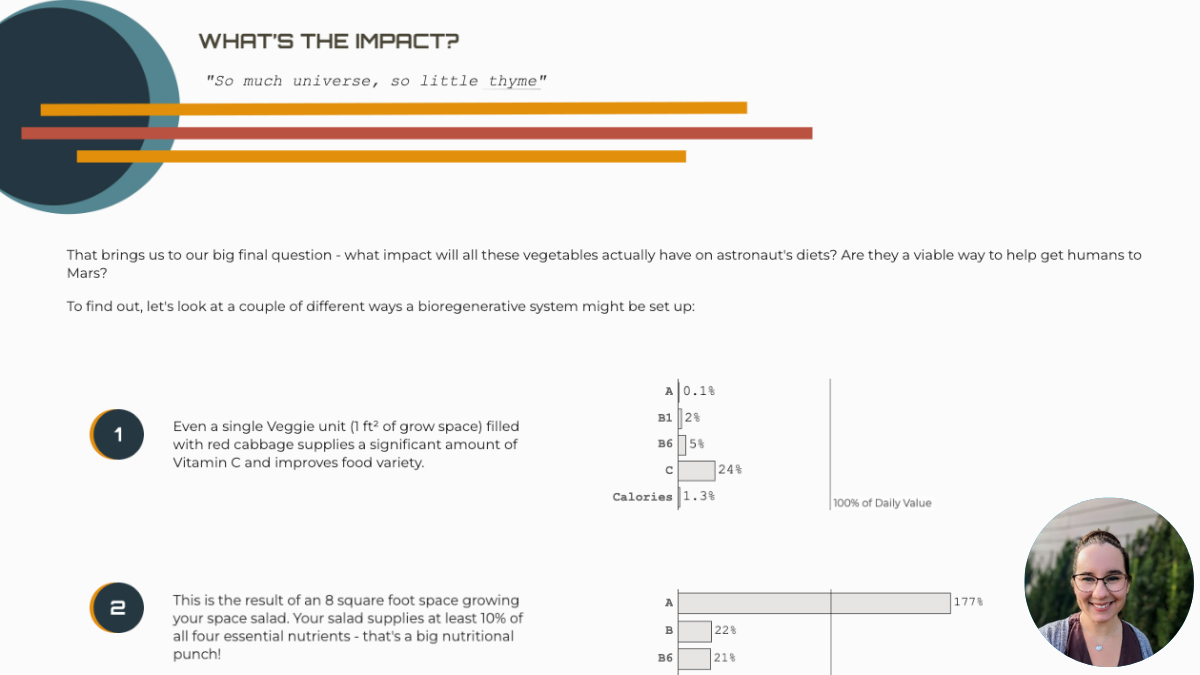
Ann Pregler: This is my third time entering Iron Viz. I was inspired for this year's entry by my garden. I grow a portion of my family's food, but we always have the option to run to the grocery store to pick up more supplies - I wanted to explore the role gardening might play during space travel, when the nearest groceries are 30 million miles away.
Iron Viz runners up
The World is Going Bananas
By Stephen Detzel
United States
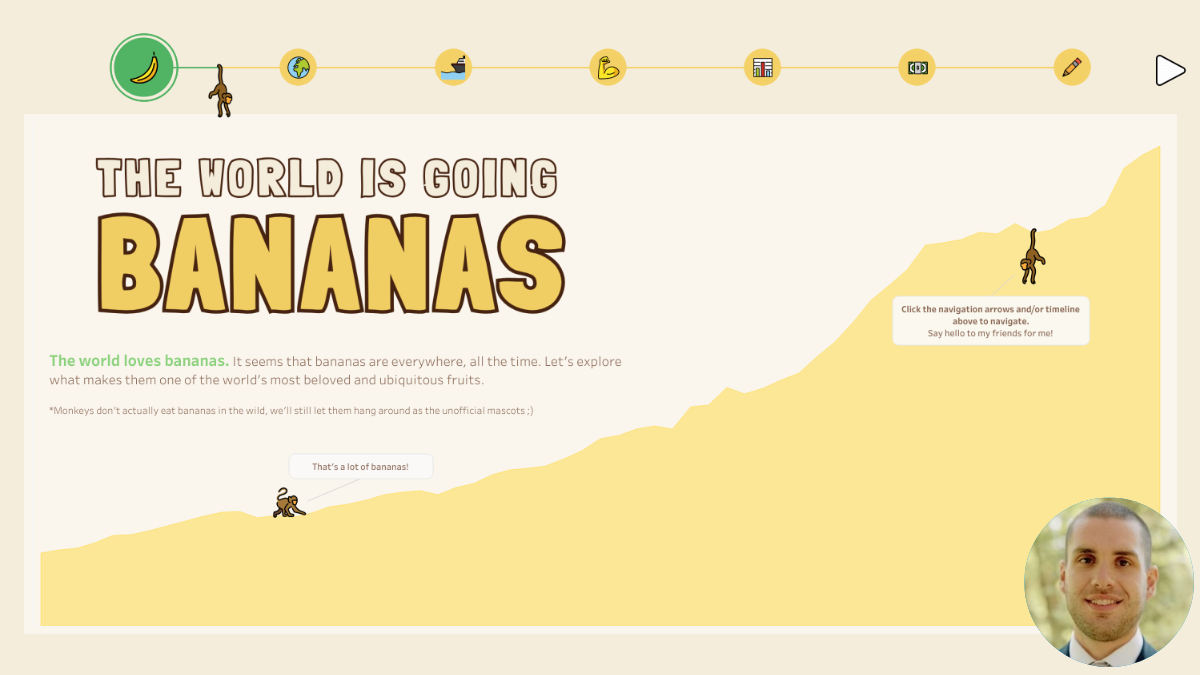
Stephen Detzel: My wife and son love bananas! Along with my casual curiosity about how they end up at my local grocery store from across the world for only 20 cents each.
Sunday Dinners
By Kimly Scott
Naarm, Victoria, Australia
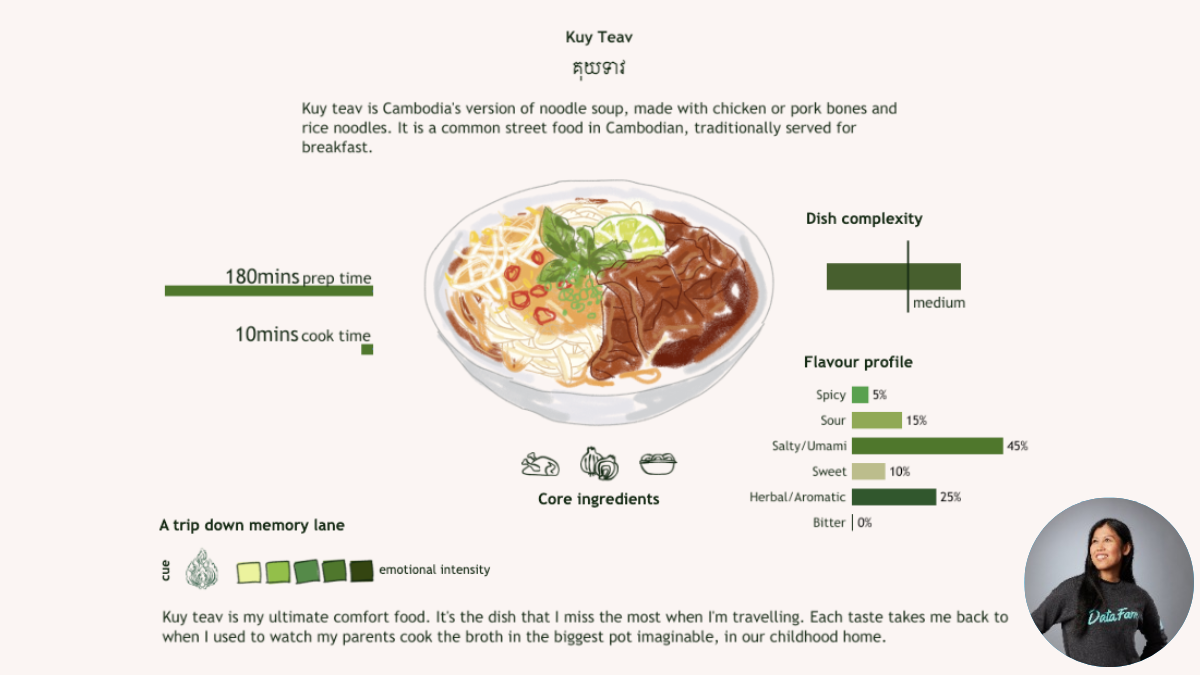
Kimly Scott: I wanted to show the powerful connection between food and memory and in doing so share my love of Cambodian food and culture.
Only to be Sociable
By Heather Cox
Adelaide, South Australia, Australia
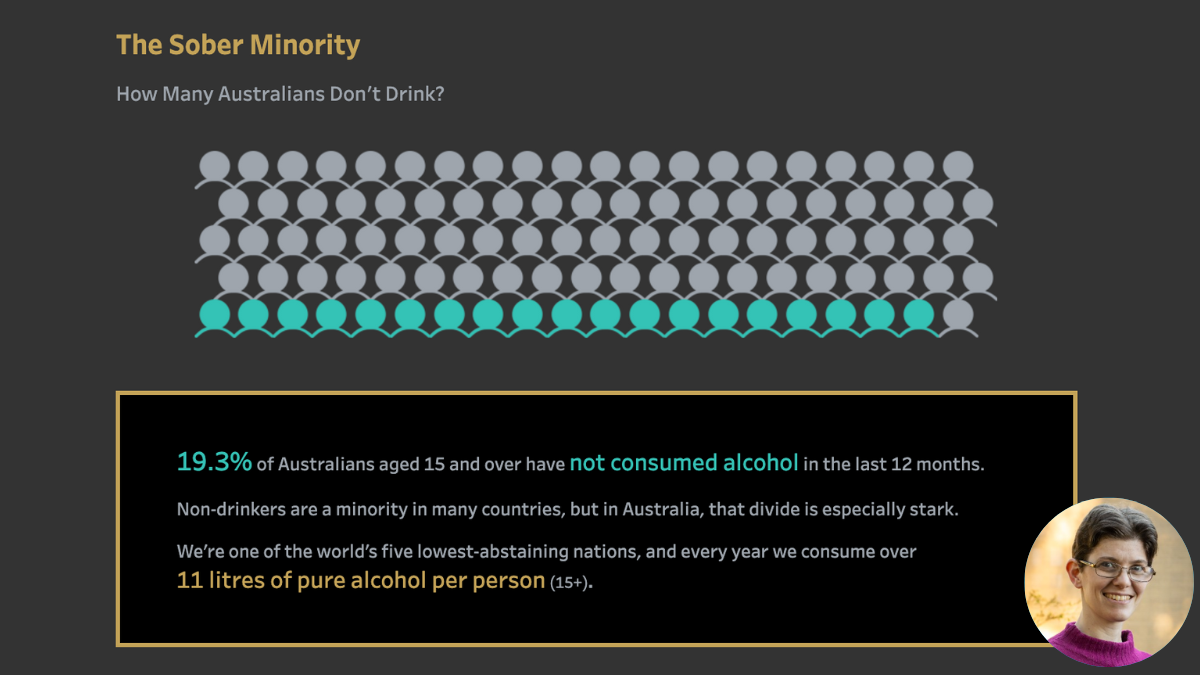
Heather Cox: I really wanted to build the tool to optimise mocktail selection based on shared ingredients! Exploring why mocktails felt important helped me uncover a story about drinking culture and belonging.
Late-night Snacks
By Shreya Arya
United Kingdom
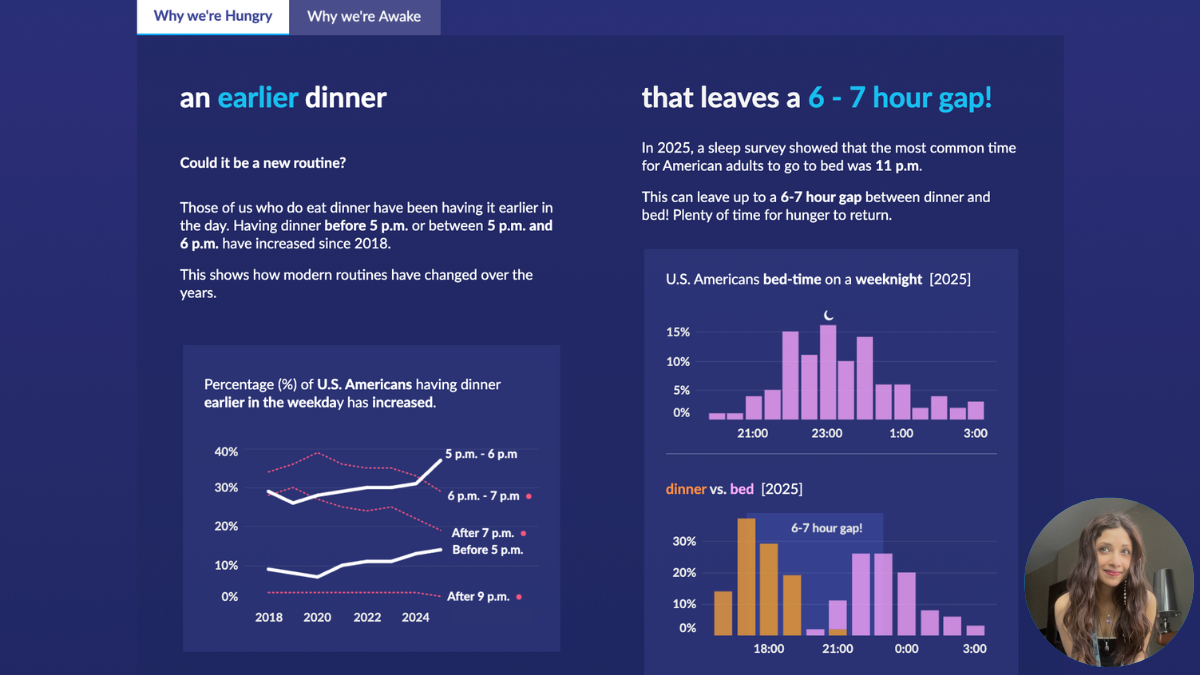
Shreya Arya: As an avid night owl and late-night snacker, I wanted to explore this habit in more detail, from the feelings behind it to what it might be costing us. To me, late nights feel full of creativity and freedom, so I wanted to bring some of that playfulness into the design through the shapes and colours.
From Empire To Identity
By Rob Taylor
England, United Kingdom
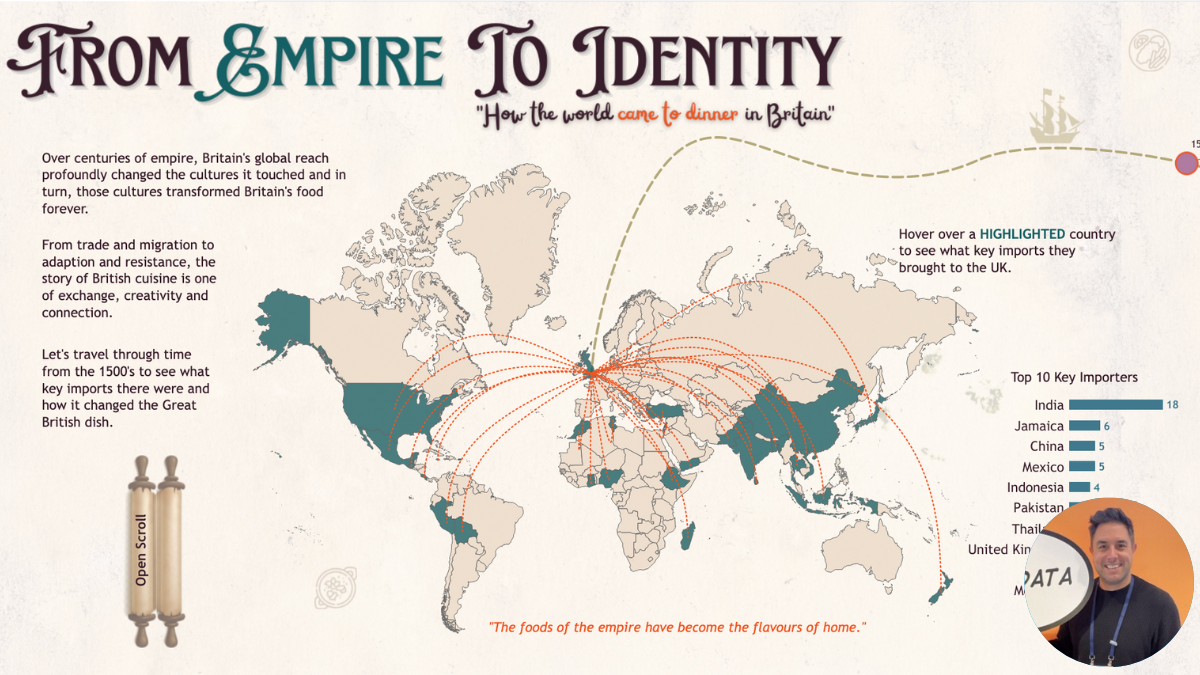
Rob Taylor: I wanted to create a fun story showing how imports to the UK completely changed our food culture. Going from top level down to focussing on one area, the curry, wrapping it all up with a personal touch of our family favourites dinner table and where they came from. The overarching theme was a pirate treasure map style that led the viewer through the story.
The Global Story of Tuna
By Hideaki Yamamoto / Chasoso
Ishikawa, Japan
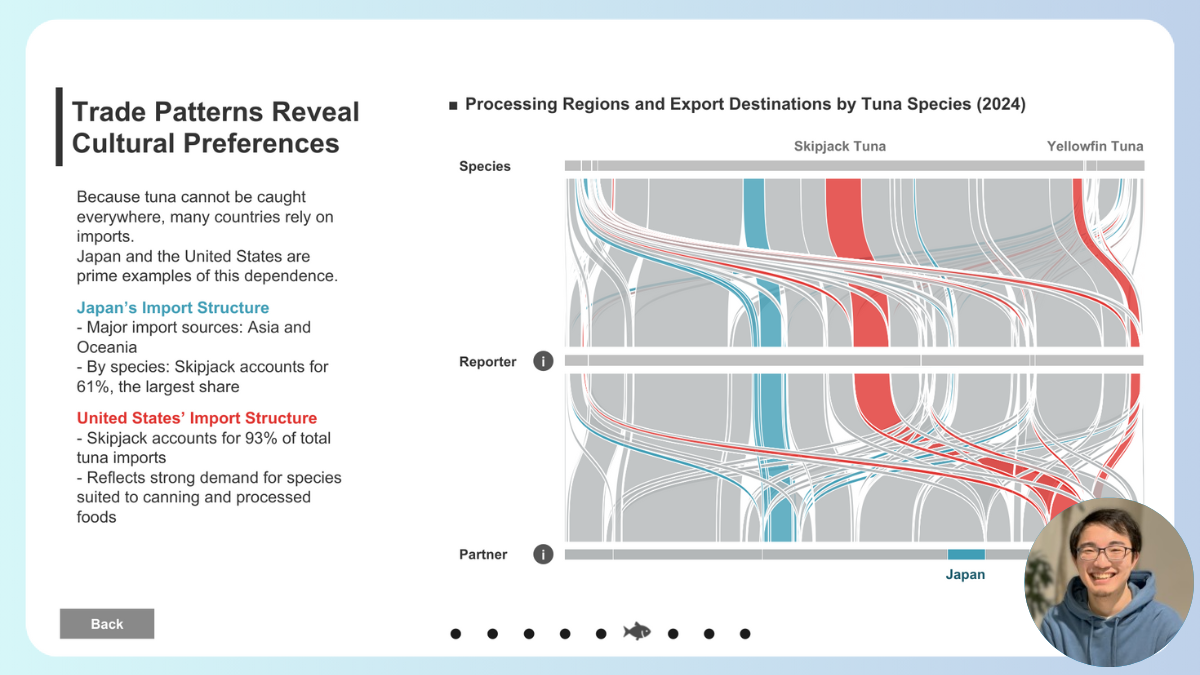
Hideaki Yamamoto / Chasoso: As a seafood lover, I explored tuna, often called the "king" of sushi in Japan. While I once associated it mainly with being eaten raw, this project helped me learn more about fisheries and diverse food cultures.
Can Eating Less Meat Save the Planet?
By Virginia (Ginny) Moench
Boone, North Carolina, United States
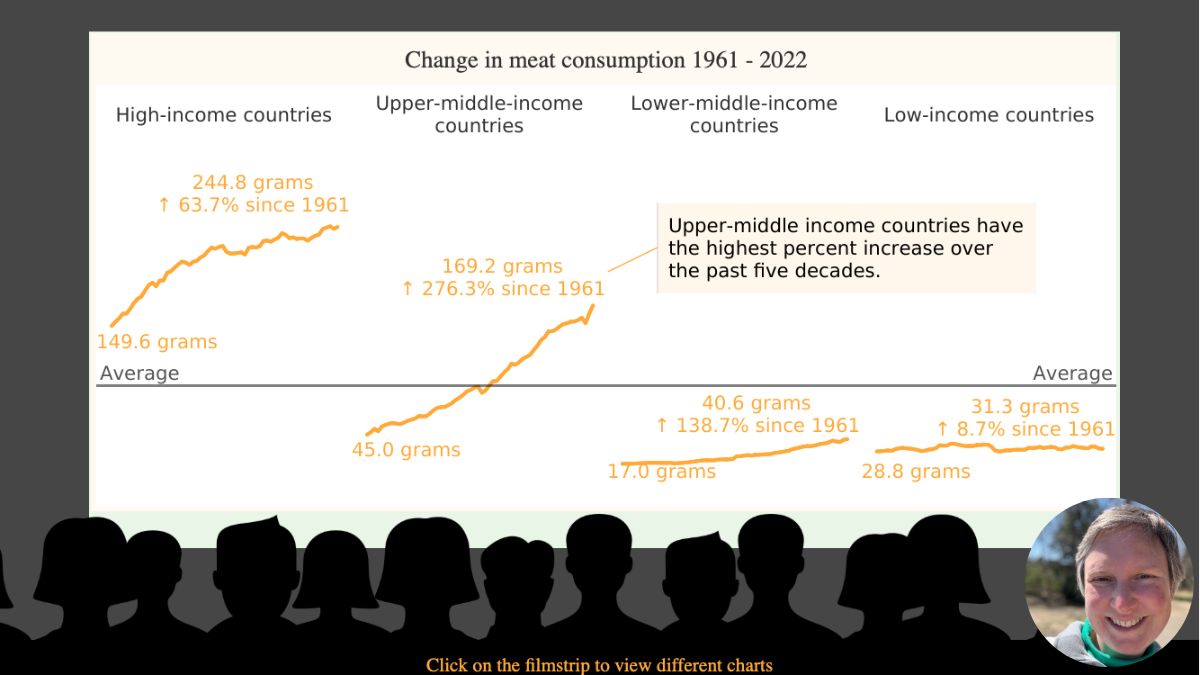
Virginia (Ginny) Moench: I was inspired by one of my heroes--Jane Goodall--who passed away shortly before the Iron Viz feeder began. I wanted to share her message of hope and a plan for how we can all help save the planet through our actions and choices (specifically, what we eat).
Countdown to the Iron Viz 2026 Championship at Tableau Conference
Congratulations to all of the finalists and thank you to everyone who participated. Who will claim the Iron Viz Champion title this year? The countdown is on to the live competition at Tableau Conference, May 5-7, 2026 in San Diego. Sign up to attend in person or watch on Salesforce+.
Want to experience the excitement of the top 10 finalists announcement with co-hosts, Iron Viz 2025 champion, Bo McCready and Tableau’s Archana Ganeshalingam? Watch the event.
Autres sujets pertinents

DataFam Roundup June 2026

DataFam Roundup May 2026

Iron Viz 2026: Read Between the Data
 28 Mai, 2026