New in Tableau 9.0: Admin Views!


At Tableau, we strive to give users the best tools to analyze their data and arrive at new insights. One such tool for server administrators is the Admin Views feature. Pre-packaged in every installation of server, these views allow administrators to monitor and analyze data from their own Tableau server, thus using BI analytics on their own BI solution. The Admin Views allow you to detect bugs, track user activity, plan upgrades, and properly allocate resources. Here's an introduction to the capabilities of the newest version of the Admin Views, shipping in Tableau 9.0.
Capabilities and Use Cases
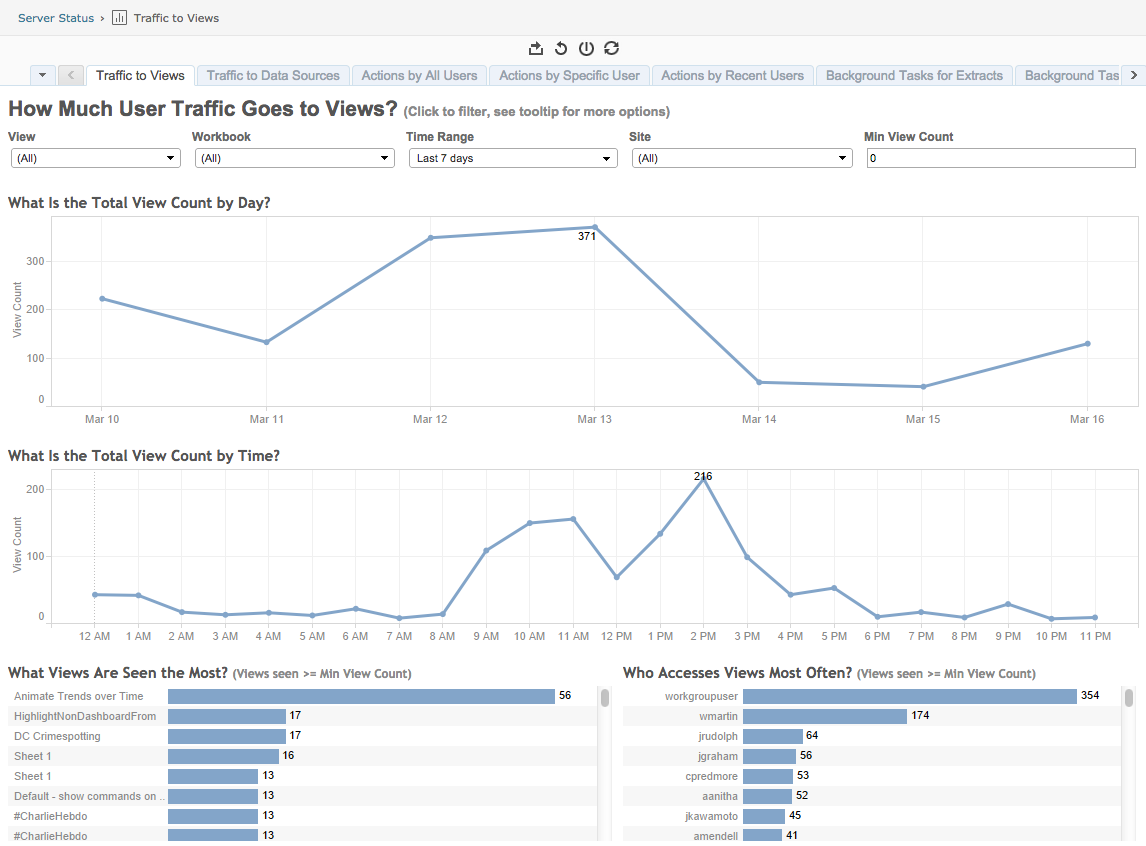
A common administrator question is: "What is my top content?" The "Traffic to Views" dashboard answers this question by displaying the most viewed content and the most active users on a site or server. Moreover, because all the new Admin Views contain interactive fields, you can change your question with a click and instead ask questions like: "What is the top content this user is interacting with?" Nearly any field can be selected, allowing new questions to be answered. The "Traffic to Data Sources" dashboard contains similar information about data sources.
Another administrator goal might be to analyze the usage habits of users. The "Actions by All Users," "Actions by Specific User," and "Actions by Recent Users" dashboards allow you to monitor user behavior in order to pick out overall trends, so you can schedule tasks at the appropriate times.

Finally, the Admin Views can be used to monitor the health of your server and help plan expansion and optimization efforts. By analyzing the runtime of extracts, background tasks, view load times, and space usage, these Admin Views can help you determine which operations require the most resources and decide whether more resources or a reallocation of current resources is necessary.

New AND Improved!
For those familiar with our server product, you'll know that Admin Views have existed for many versions. In the past, these views were designed to monitor a system by providing a quick report with a specific number of metrics. While maintaining all the metrics of the old Admin Views, the new version's views also allow more freedom, going beyond monitoring and into BI-on-BI analytics. No longer are the Admin Views static screens; now you can interact and chain questions together to gain new insights.
You’ll be able to get your hands on these new views in Tableau 9.0. Until then, you can expect plenty of additional resources to help you educate and familiarize yourself with our new Admin View offerings.
Want to Learn More?
Check out the rest of our Tableau 9.0 blog series:
Articles sur des sujets connexes

Extend Access to Embedded Tableau Content with On-Demand Access
 juillet 22, 2026

The Tableau+ Bundle with Premium AI, Enterprise Capabilities, and Premier Success
 juin 24, 2026

What is Tableau Prep?
 avril 30, 2026