Diving into LOD Expressions - Week 3


At Tableau, we strive to delight our customers. Sometimes, this means building popularly requested features, such as adding new data connectors to keep up with market demands. But, sometimes it means taking a big bet on a revolutionary idea forged by varied suggestions over time. We are always looking for patterns behind support cases and customer requests. If we find one, we have the opportunity to design an elegant solution that greatly enhances Tableau's capabilities. No single request led directly to creation of LOD Expressions, but rather the combination of an engaged community and a lot of time in front of whiteboards.
You can find an introduction to LOD Expressions in the first and second posts of this series. This post will continue to look at examples of typical analytic questions that all share the common property of requiring us to aggregate data on different levels than the main focus of the visualization, such as the following:
- What is the largest deal closed per salesperson, and the average of these deals per country?
- What is the cumulative number of customers acquired per day by market?
- What is the difference in year to date profit of this year versus last year, relative to the last day the data was refreshed?
There is a clear focus in each of these questions, but they also reference another context.
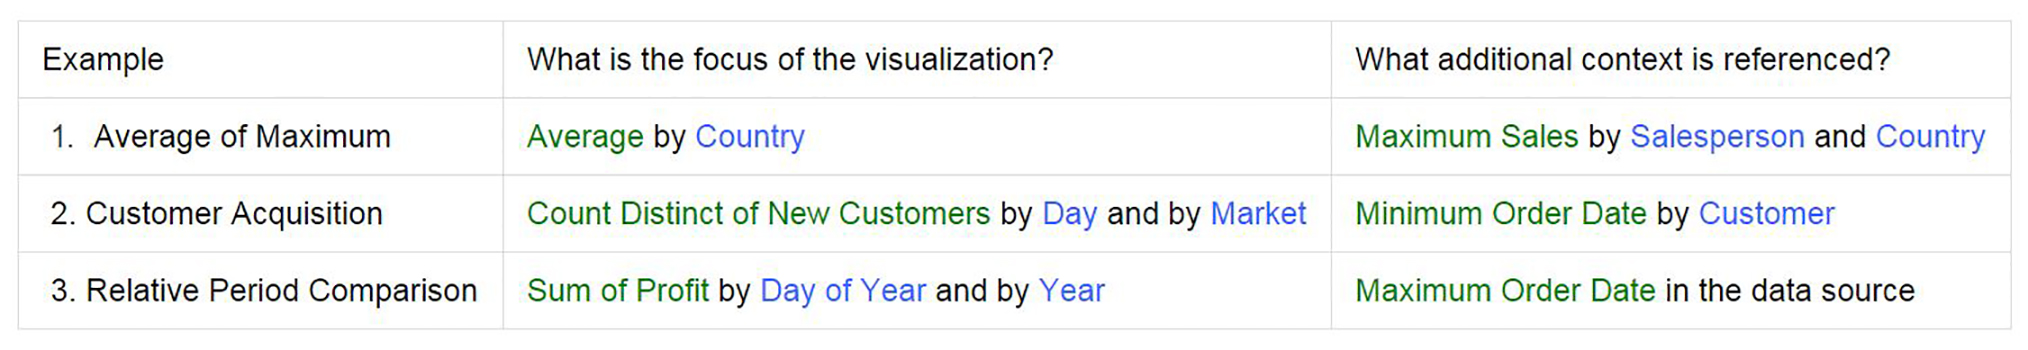
*The aggregation is in green, and the dimension used to group the aggregation is in blue, like in Tableau’s UI.
There are several ways of referencing different levels of detail. The first example looks down a level of detail, the second example looks outside the current level of detail, and the third example looks up a level of detail.
Average of the Maximum
What is the largest deal closed by salesperson and the average of these large deals per country? In the view below, the average large deal size is high in countries that are colored blue and low in countries that are orange. We can use this information to guide drill down analysis, in order to find exceptions in data that has been aggregated up.
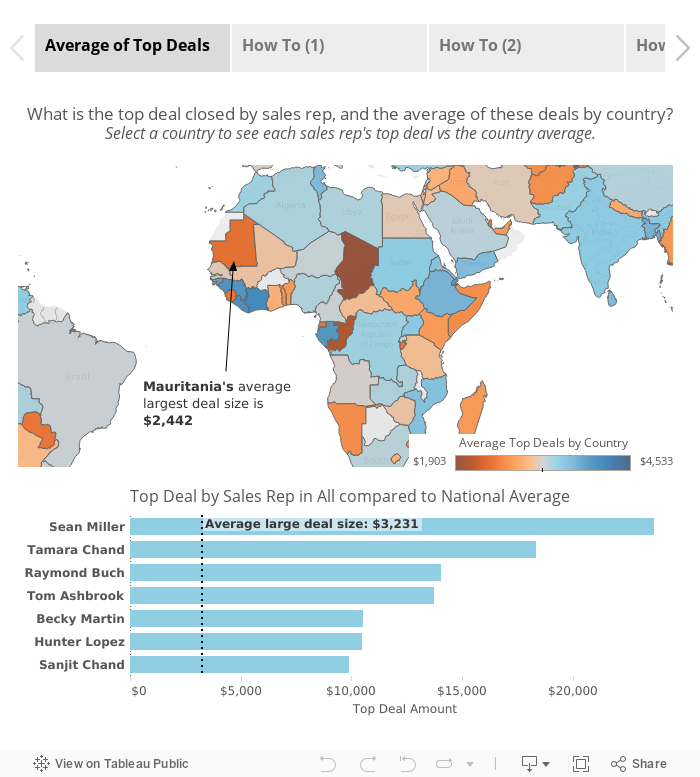
To generalize this example, you could apply a similar technique in any scenario requiring an aggregation of an aggregation, such as finding the average of the sum, the sum of the distinct count, the sum of the sum, etc
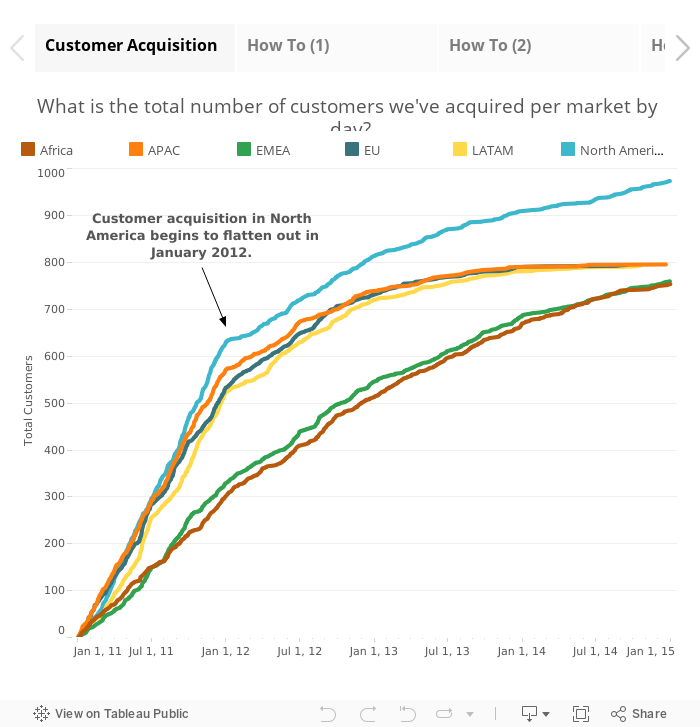
Customer Acquisition
How many customers have been acquired to date in each market? This will help understand how well marketing and sales are doing at generating new business. The steeper the line, the better new customer acquisition is. As the line flattens out, some action must be taken to increase lead flow.
This is a simple question, but without LOD expressions the solution would difficult since customers can make purchases on multiple days. To answer this question, we must find the first purchase date of each customer, and then filter out all repeat purchases.
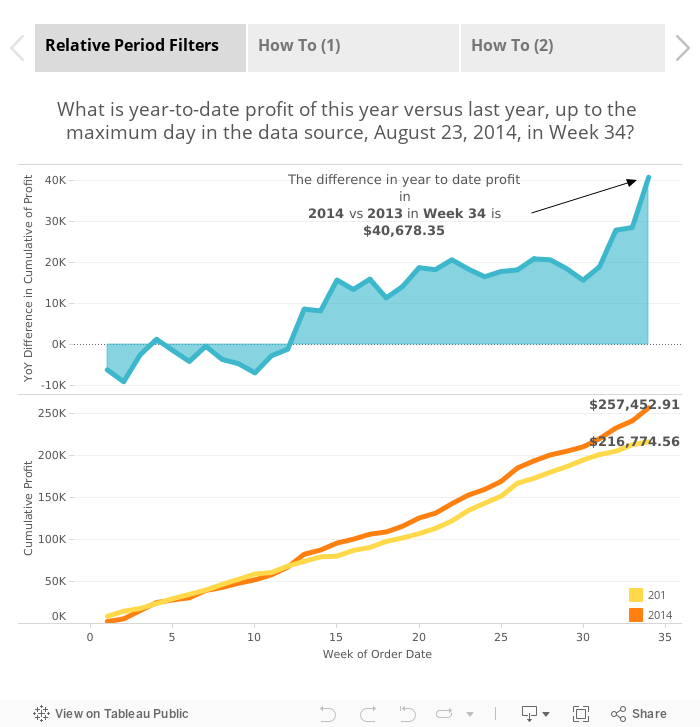
Relative Period Filtering
A very common metric used to analyze performance in operational reports is year to date and month date comparisons relative of this vs last year. We can do this easily by filtering relative to today, but what happens if the data is refreshed on a weekly basis? Suppose your last refresh occurred on March 1, but the current day is March 7. A month to date comparison would show March 1-7 of last year versus March 1 of this year. This could cause significant alarm, where none is needed!
With LOD expressions, a simple pair of curly braces solves this problem!
We hope that this blog series will bring to light some easier ways to approach your own use cases, and inspire new ways to explore and analyze your data visually.
Next week in the fourth and final post, we will roll out the Top 15 LOD Expressions!
Related Stories

VizQL Data Service from Tableau: Use Your Data, Your Way
 August 8, 2024

When and How to Use Multi-fact Relationships in Tableau
 August 1, 2024

Top data books of 2021
 December 12, 2021