Tableau 9.0 Preview: Stay in the flow with Auto Data Prep


The first step in using Tableau - before you can quickly answer questions or use all the analytic power, before you can share your rich findings with web and mobile users - the very first step is connecting to data.
As many of you know, analytics isn't just for pretty data. Many of you regularly use specialized tools and scripts to get your data ready for Tableau or spend time writing complex calculations to fix data problems.
Tableau 9.0 automates much of the drudgery of cleaning up messy data, especially Excel spreadsheets. Improvements include the Tableau Data Interpreter to automatically identify the structure of an Excel file, new tools to pivot and split data, and a new layout to quickly operate on metadata. Together with the Automatic Data Modeling that was released in 8.2, these new features help you quickly get your data ready for analysis.
Tableau’s philosophy with data preparation is to enable anyone at anytime to make fundamental changes to their data connection. This means the capabilities need four key attributes to empower you:
- smart – they should apply automatically and have a deep sense of the data
- fast – they need to operate at near real time even on big data
- repeatable – they need to allow for changes to the underlying data like new values, rows and columns
- flexible – they need to allow you to make significant changes at any time while preserving your work
In Tableau 9.0 we plan to release a host of new capabilities to make this possible. Let’s take a tour:
Tableau Data Interpreter
Do you have Excel files that look like this?
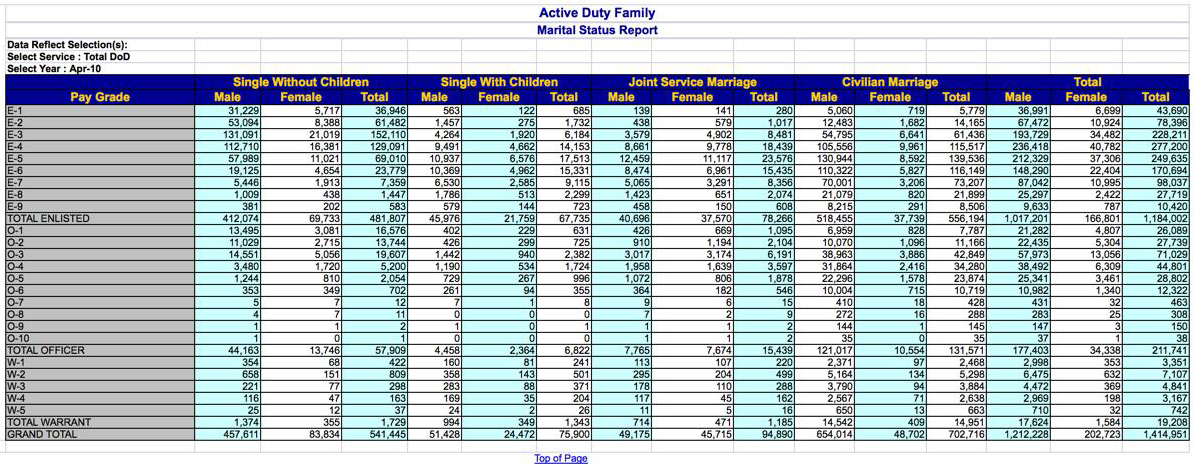
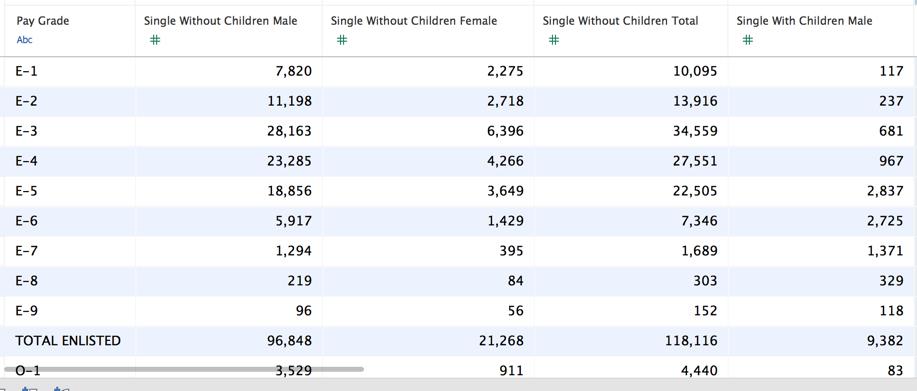
Tableau automatically detects the location (the data values start in cell B8) and structure of the data (e.g. there are compound headers running across the sheet) to turn it into data that is ready for analysis.
Pivot
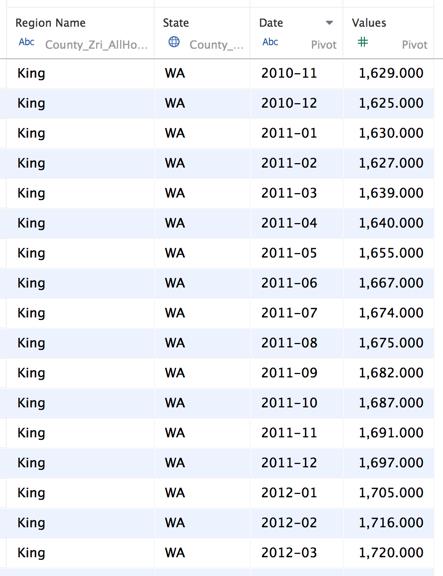
Many text and Excel files have column names that are actually useful data values. For example this data has years and months as the field name.

For the best analytic experience, this data should have a column named “Date” and another with the data value instead of dozens of date columns. In other words we need to pivot part of the data set. Simply select the columns of interest and choose “Pivot” to get this:
Split
There are many columns that contain compound information such as phone numbers (area code), email addresses, URL’s and many more constructs that may be unique to your data. With “Split”, Tableau will automatically sample the data, detect multiple delimiters, and create new columns for you. I have a column with zip code and location combined together. A data value looks like this: 90001 (33.973271508000494, -118.24896959899968). Consider the crazy string calculations you would have to write to parse out the three parts.
Regex (the ability to use regular expressions) is an improvement, and Tableau has those too now. But writing regex here is still unapproachable for many. Instead, right click and choose “Split” and you get:
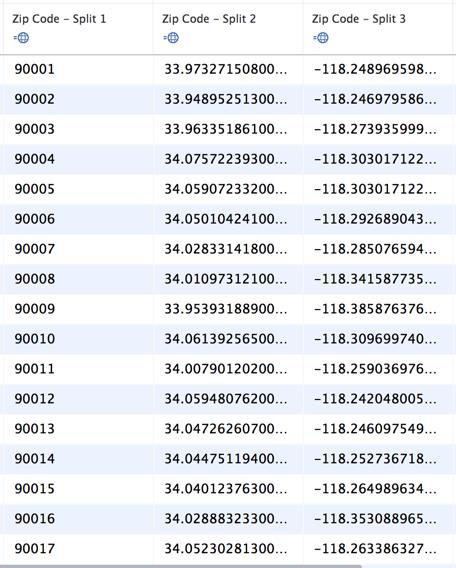
No prompts, no choices, just three nicely cleaned up columns. If the autosplit can’t find a structure to your field, it will ask you to provide a delimeter (typically a comma, space or other character) and you can always edit the resulting calculations with our simple SPLIT() function. That’s three new ways to easily split a column into just the parts you need.
Metadata Grid
When preparing data for analysis, sometimes a list of fields is more useful than a preview of the data so we’ve added a “Metadata” view of your connection.
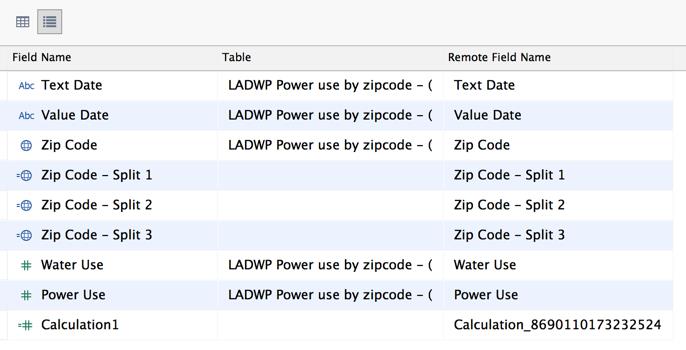
This view allows me to see more about my fields at a glance, quickly rename fields and perform bulk operations on a selection of fields. Do you want to hide a bunch of fields? Simple. Select them and choose “Hide”.
The best part of all of these features is that they don’t need to be applied in any special order. In fact, at any time in your analysis, you can click the new “Data” tab and make changes to your connection. Add tables, change joins, edit field names, perform any of the new operations, etc. Switch back to your analysis and see the impact of your changes immediately. This ability to keep you in the flow of analysis is unprecedented.
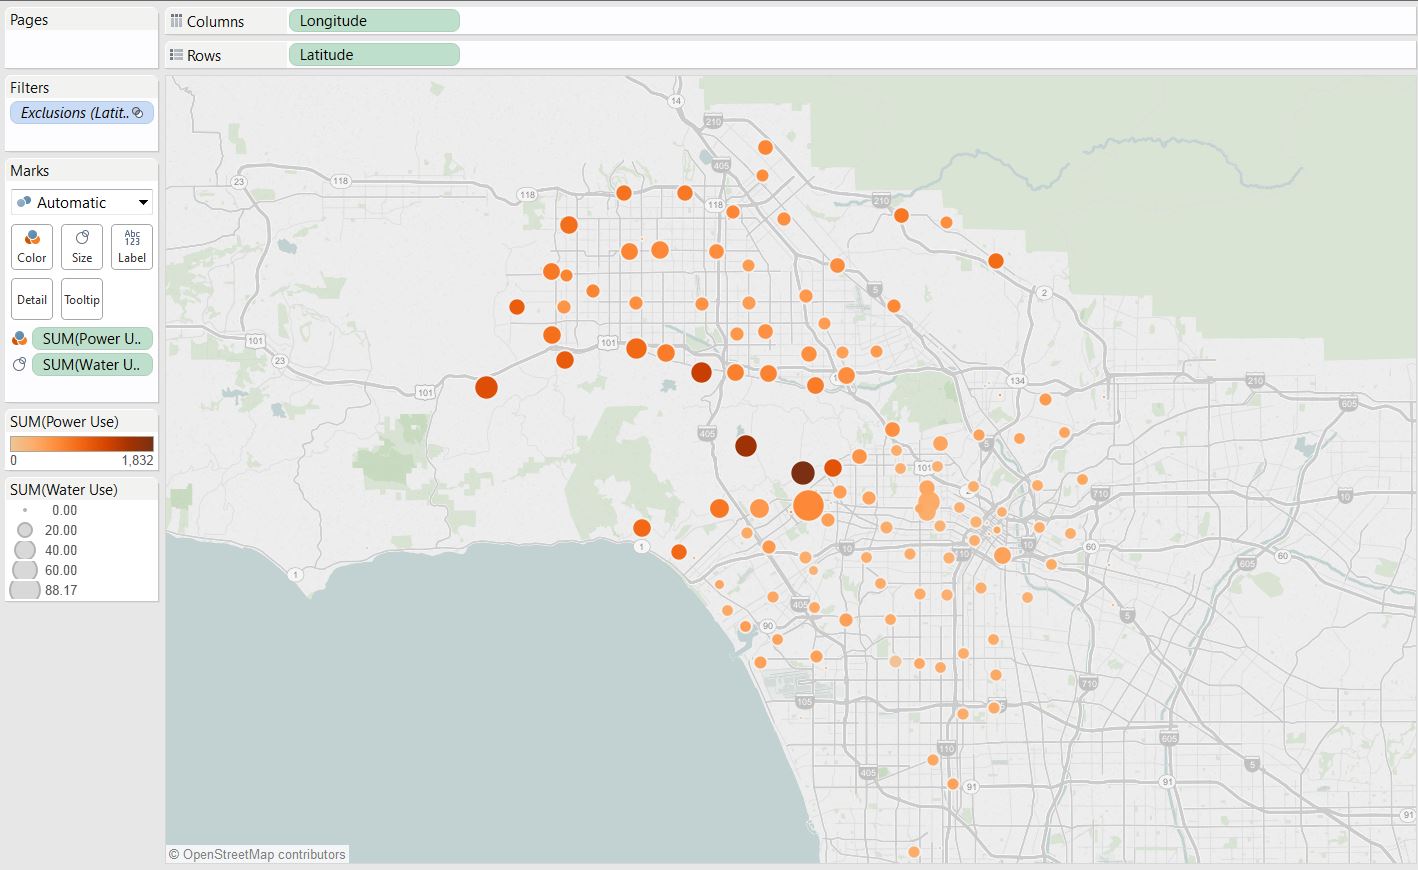
Of course, all of this data prep is foundational to the really fun part—making beautiful, useful visual analyses. You may be the only one that knows what went into cleaning up your data, but everyone who interacts with your final viz will get to enjoy the result.
Want to Learn More?
Check out the rest of our Tableau 9.0 blog series