Using data to drive conversations about climate change
Most conversations about climate change have a global lens. Yet, for people to more efficiently engage in climate action initiatives, they need to see themselves and their own local communities in the narrative. That is precisely what a trio of organizations are doing—driving local conversations about climate change. Let’s dive into the work of these impactful organizations and learn more about how they are using data to change the local narrative on climate action.
Making sense of complex climate change data
In 2016, Headwaters Economics began partnering with Tableau to build their data capacity to identify and solve problems related to the use of natural resources. Headwaters has been able to produce powerful visualizations to help communities make sense of complex climate change data and issues. They use Tableau to provide powerful, easily understandable data visualizations to local governments, decision-makers, and community leaders to inform community development and land management decisions.
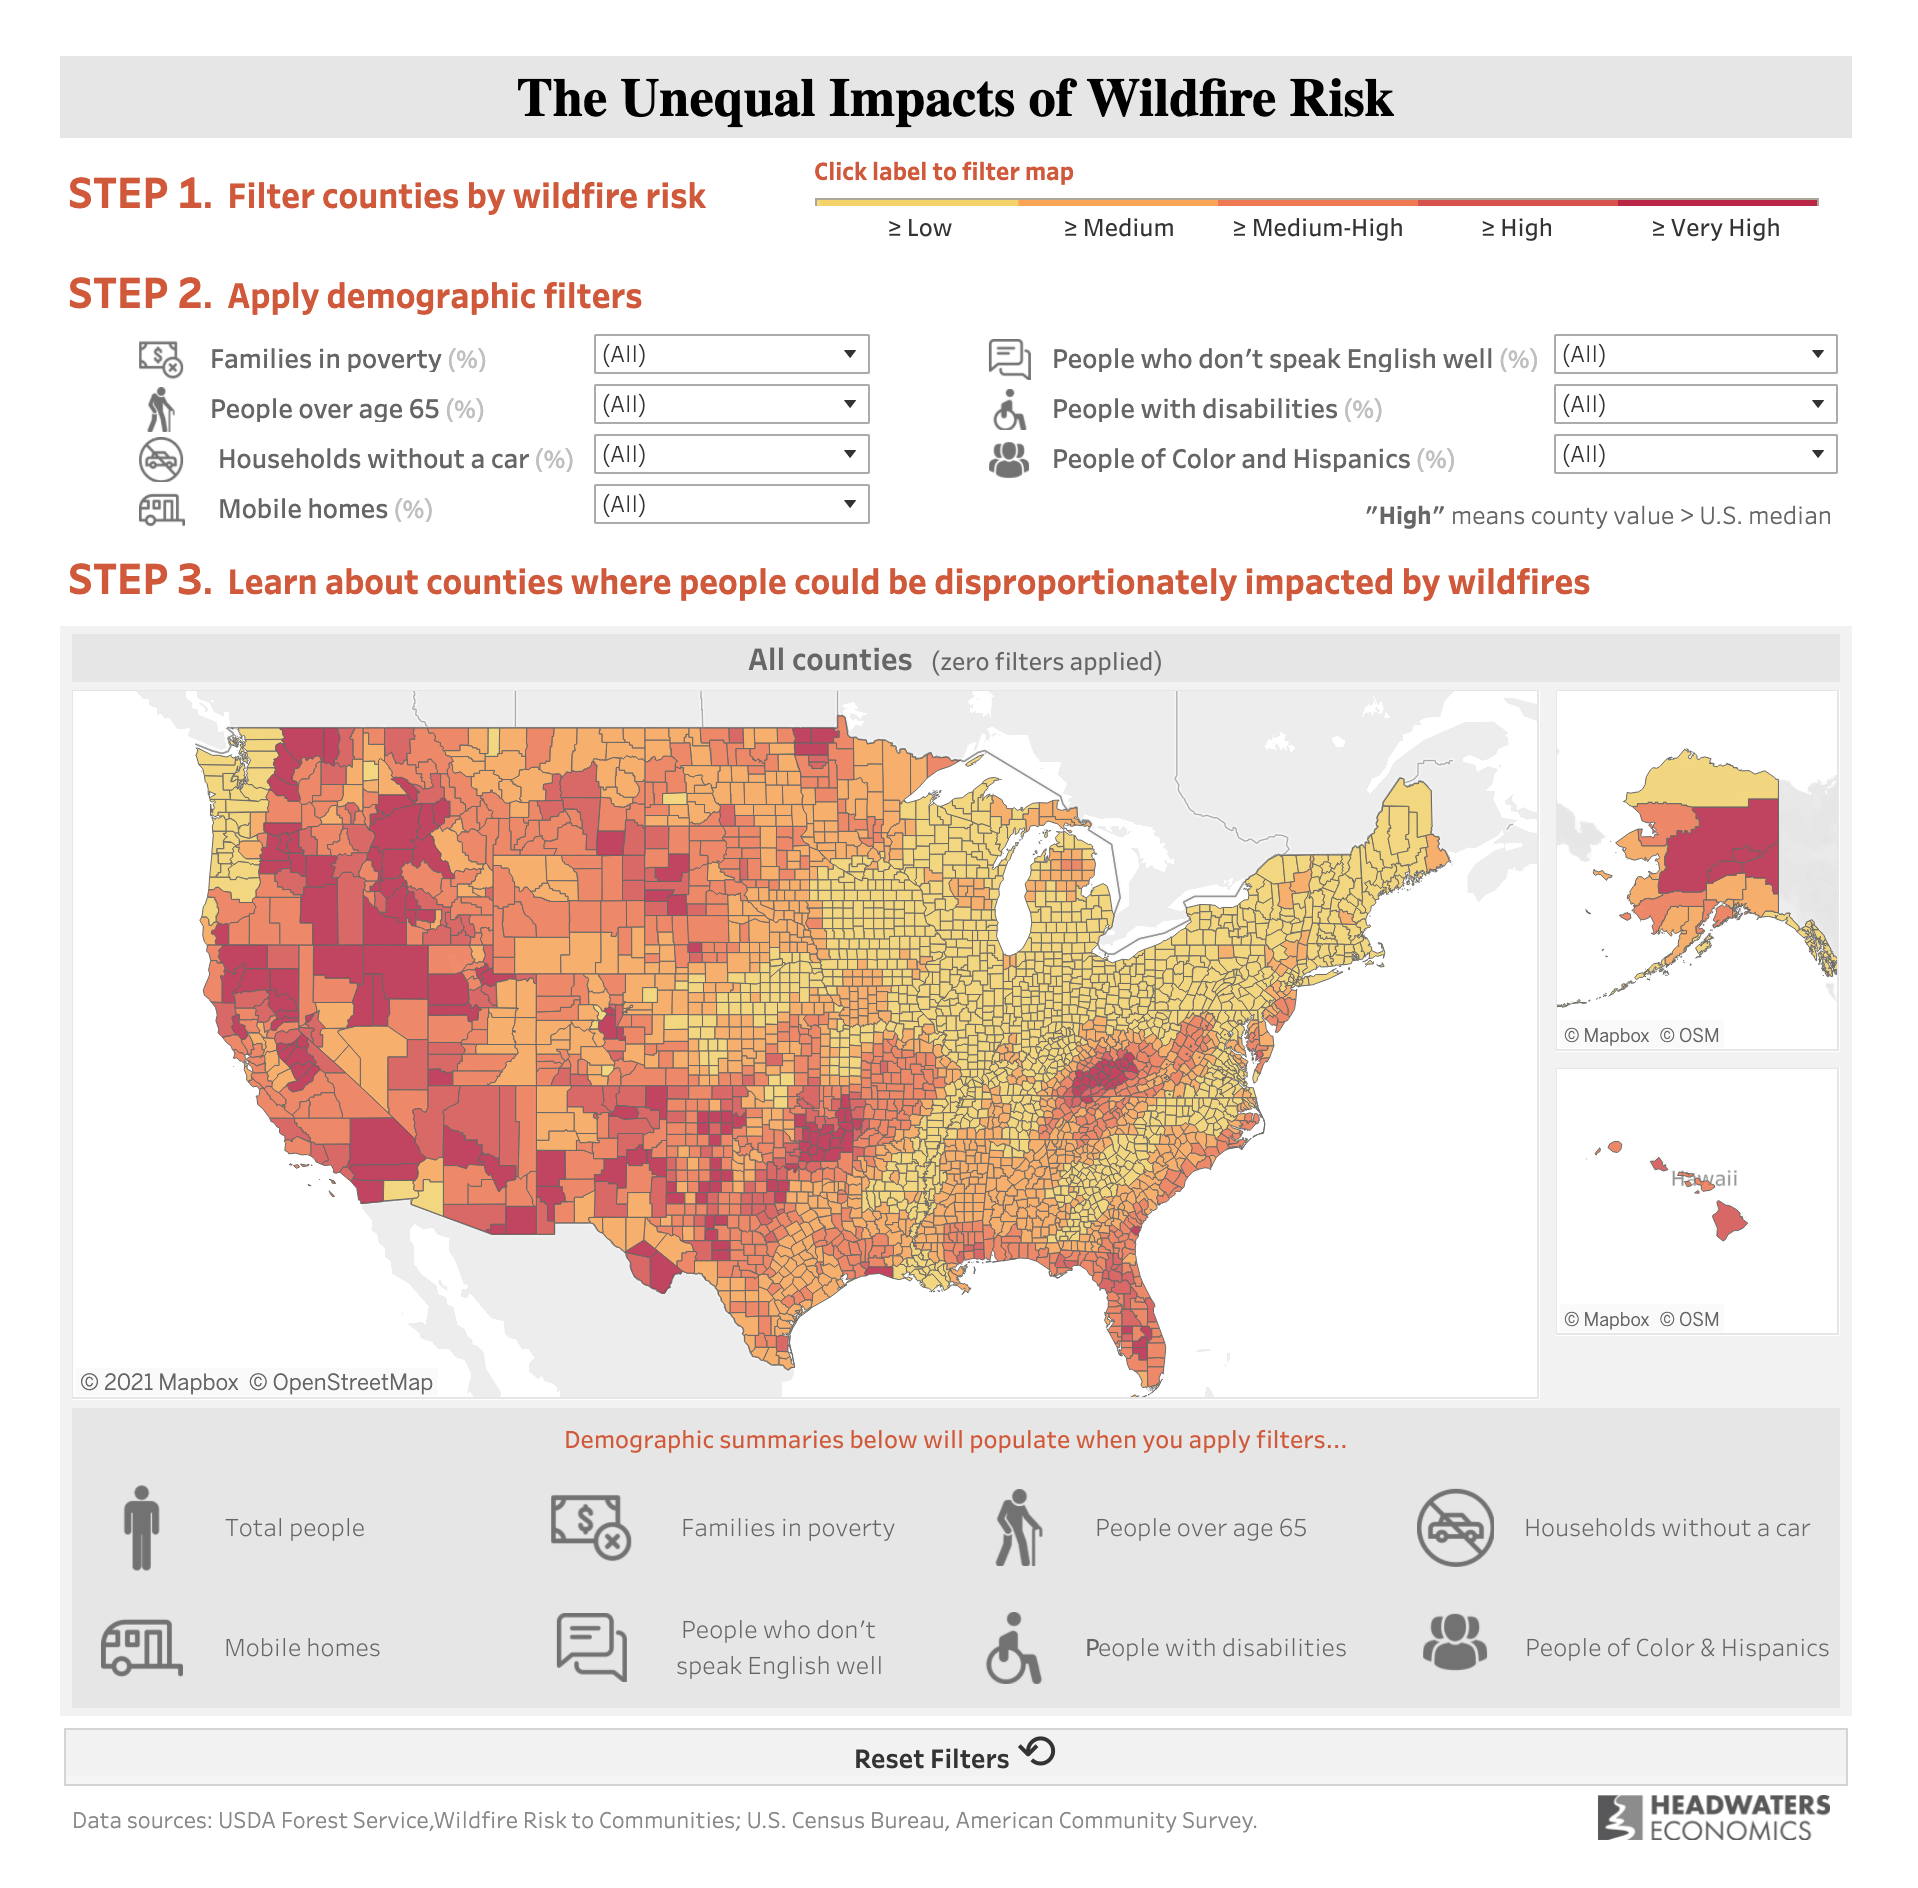
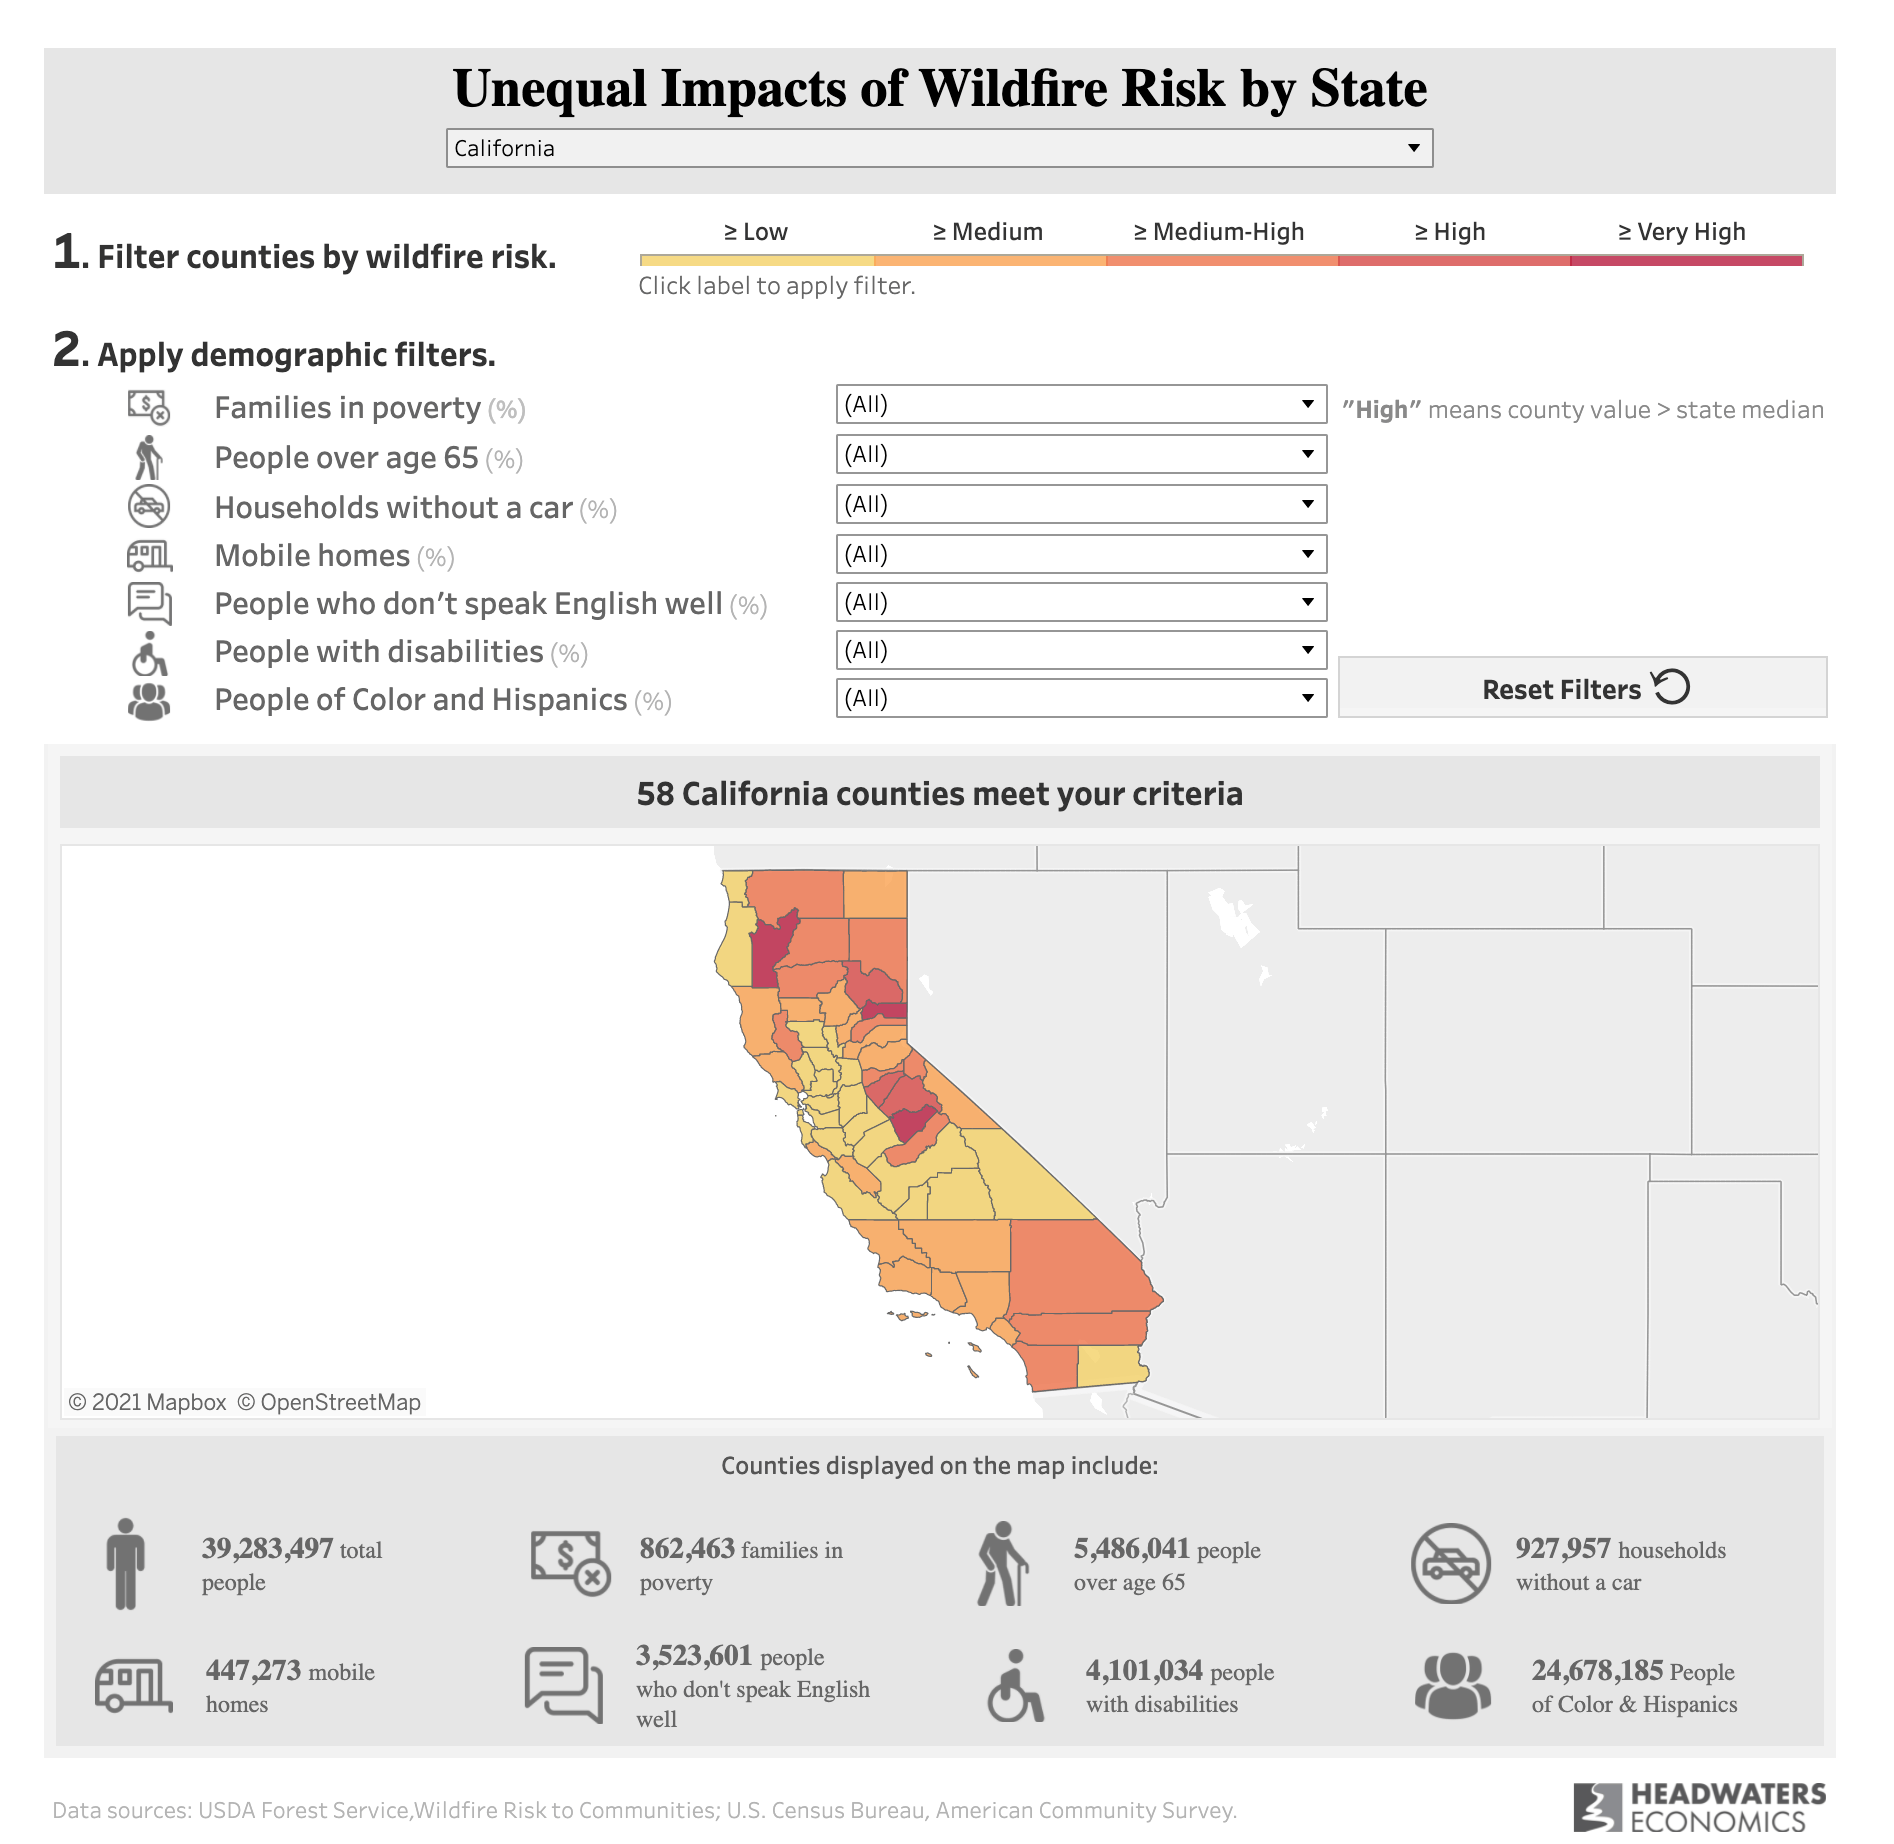
Part of this work includes collecting economic data from communities around National Monuments and National Parks, and creating visualizations showing that preserving land provides economic benefits to surrounding communities. As an example of this effort, Headwaters created two dashboards to visualize the unequal impacts of wildfire in the United States—one providing nation-wide information and another one for state-level data.
These dashboards allow users to click, navigate, and learn about effective land-use planning measures to mitigate wildfire risks at the home and community levels. Headwaters also provides best practices to shift the wildfire narrative from focusing on issues like the number of acres burned to the number of buildings destroyed and the local community cost of the destruction. Headwaters’ goal is to increase awareness about how people think about wildfires and the policies for managing them.
According to Kelly Pohl, associate director of Headwaters Economics, “A lot of leaders don't actually have a good sense of where exposure to wildfire intersects social and economic vulnerability. And so our goal was to provide access to that information so that policymakers, especially at the national and state levels, could understand not only where wildfire risk is high, but where people may need extra support in preparing for and recovering from wildfire.”
With Tableau, Headwaters has created high-quality, powerful dashboards that local governments, decision-makers, and community leaders can use to help communities identify where people may be vulnerable, and how strategies such as land use planning can help reduce risk. Using Tableau, the Headwaters dashboards show how critical data is for understanding the risks of a complex problem like climate change—but also for identifying potential solutions.
Climate change is a social justice issue
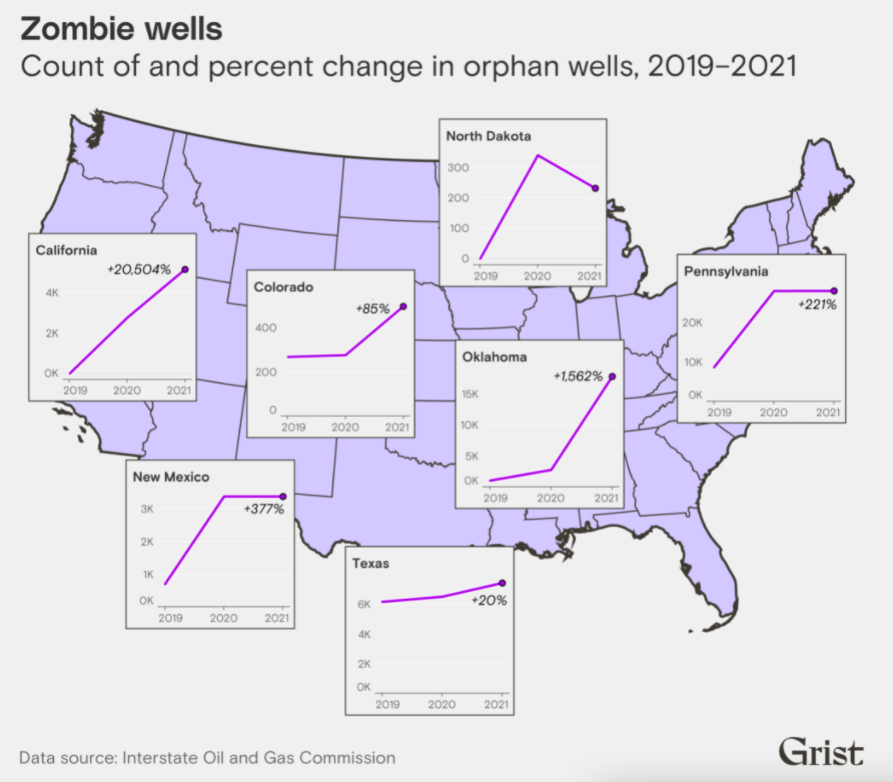
Tableau first partnered with Grist in 2019 to support the creation of a new climate data journalism team focused on bolstering data-driven communications infrastructure in the climate movement. Since then, we have extended our partnership to increase the number of people that believe climate is a social justice issue and the number of people who believe that climate change can be stopped. This team is focused on producing high-quality data journalism and visualization, in partnership with local and national media on distribution to reach new audiences.
As Grist’s Senior Data Reporter, Clayton Aldern, explains in an If Data Could Talk interview, “You can only tell the story of climate change if you tell it as a local story. And so we argue climate change and environmental justice by definition is a local issue, something that happens in place. We partner with local newsrooms in our reporting, we seek to tell stories that appeal to both a national audience, but to a community for whom stories are most relevant.”
Clayton Aldern leads this data-journalism unit focused on telling persuasive, visual data-driven stories for how to decarbonize the planet. Their goal is to reach the public, shape discourse and inspire action in the streets.
Access to data is another key aspect of Grist’s partnership with Tableau. As Clayton Aldern highlights, the partnership allows “reporters to have access to the data they need when they need it.” Tableau provides introductions to Tableau’s customers and partners that have relevant socioeconomic, demographic and climate data that is critical to Grist’s reporting.
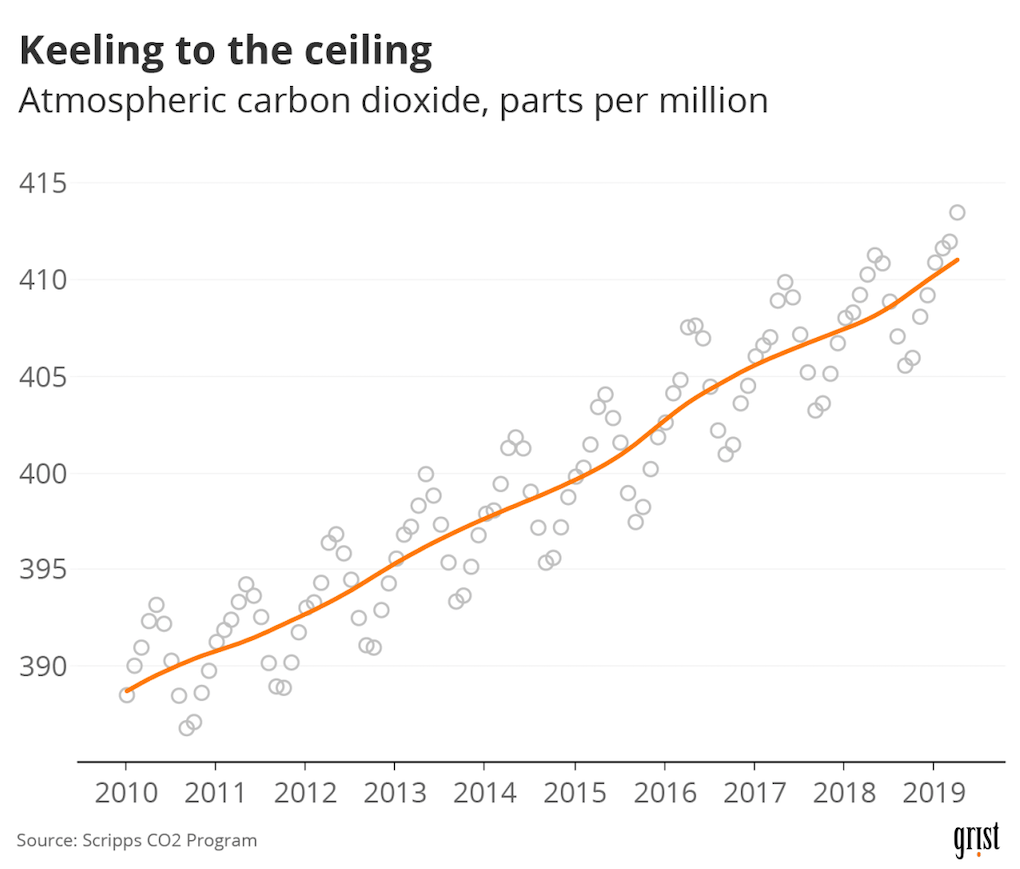
Thanks to this partnership, Grist has built one of the nation’s premier data journalism and visualization units focused on climate change.
Improving forest management and market transformation
The Forest Stewardship Council (FSC) has 25 years of experience in sustainable forest management. They have certified and protected 231M hectares (500M acres) of forest across 89 countries.
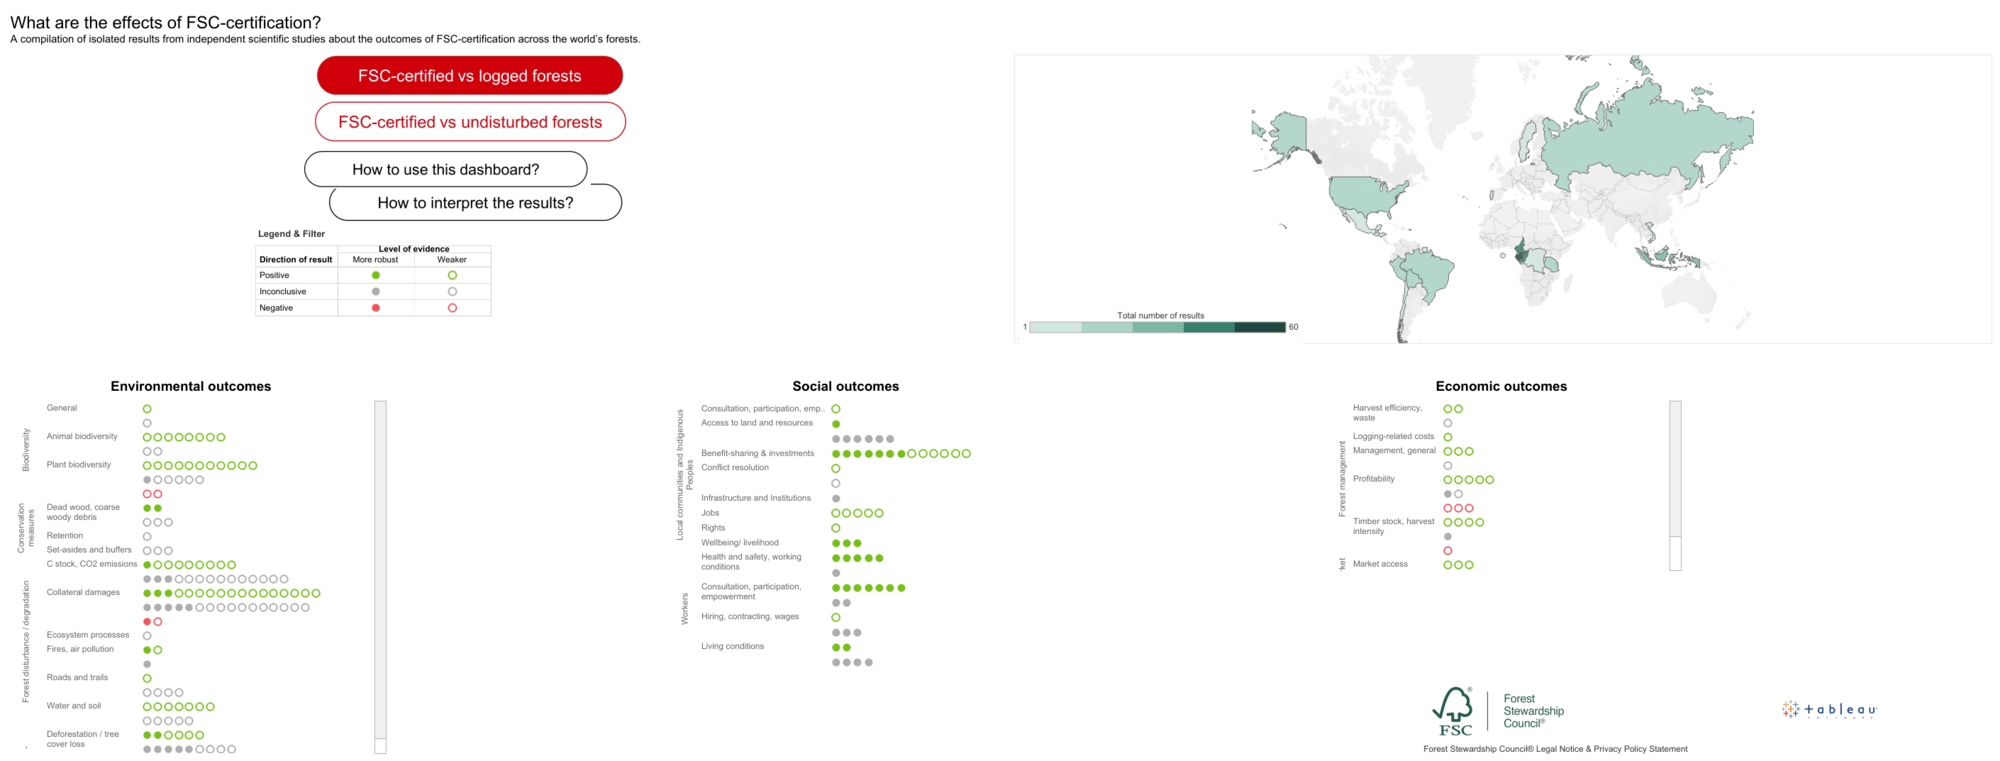
Their partnership with Tableau started in 2019 to enable their vision for improving the use of data to protect global forests. Using Tableau, FSC has built a map to provide a new way to see the growth in global forest area certified to FSC Principles and Criteria, as well as the global supply chain certification growth.
This data enables FSC to display the most up-to-date information in an easy-to-understand format, and enables users to download the datasets directly with an improved and intuitive interface. This information is particularly relevant for local communities where FSC has managed forests, as they need to stay informed about local, country-specific adaptations of FSC standards.
Local communities benefit from FSC certification in many ways, including better working conditions, access to new markets, increased income for the community, and preservation of wildlife. These and other factors are captured among the environmental, social, and economic outcomes of the FSC Impact Dashboard.
With these insights, FSC has a better understanding of their local impact, as well as information needed to better allocate resources and address challenges, ensuring that FSC continues to improve sustainable forestry standards worldwide.
As we celebrate Earth Month, we want to raise awareness about impactful organizations transforming the traditional climate narrative using data to effectively advocate for climate action.
These are only a few examples of how Tableau is helping partners incorporate diverse voices into local conversations to develop data-driven equitable climate solutions. To learn more about our work in Climate Action visit our website.


