DataFam Roundup: May 15 - 19, 2023


Welcome! Dig into this week's DataFam Roundup—a weekly blog that brings together community content all in one post. As always, we invite you to send us your content—and the DataFam content from your peers that have inspired you! Find the content submission form here.
Community Highlight
To recognize new and consistent Tableau contributors—we’re excited to have a section within the weekly DataFam Roundup called the Tableau Community Highlight. Find out how to get involved.

Jonathan MacDonald, Solutions Engineer at The Information Lab and Coach at The Data School
London, UK
Jonathan MacDonald is a Solutions Engineer at The Information Lab and Coach at The Data School. He stays active in the Tableau Community by posting tutorials on YouTube and co-hosting the Global Tableau Server & Cloud Virtual User Group.
Jonathan began using Tableau in 2011 through the company he was working with at the time. Before using Tableau, he spent a significant amount of time working with spreadsheets but after learning Tableau, the laborious activity went from taking him almost a full day’s work to about five minutes. This stark improvement motivated Jonathan to continue his Tableau journey and believe in the power of Tableau.
On YouTube, Jonathan shares Tableau tips and tricks with inspiration from the Community Forums, User Groups and Whatsapp chats, and through his own personal conversations with Tableau users. He focuses on hacks and tips related to Tableau Server and Cloud and chooses to share his knowledge this way because he believes it is easier to explain complex concepts in a more hands-on way. Especially after focusing on sharing his knowledge through blogs in the past, Jonathan now believes that videos are better suited to achieve his teaching goals.
Connect with Jonathan on Linkedin, Twitter, and Tableau Public, and check out his YouTube channel.
DataFam content
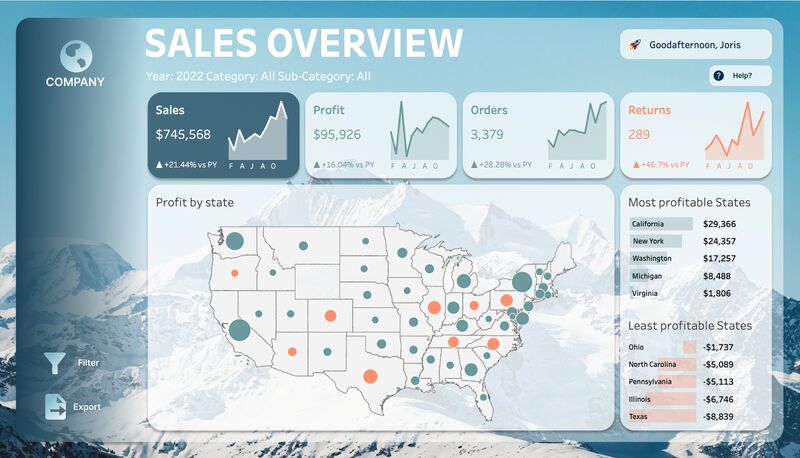
Joris van den Berg: A dashboard that changes with the time of the day
Dive into content created by the Tableau Community:
-
Anya Prosvetova: Intro to the Salesforce Developer Universe
- Ken Flerlage, The Flerlage Twins: A Guide to Embedding Tableau # 1: A Primer on Embedding
- Mark Tossel, Coffeelytics with Mark Tossell: Secrets to success with data & analytics: An interview with Tableau Visionaries, THE FLERLAGE TWINS!
- Zach Bowders, Data + Love:
-
Jacqui Moore: Optical Illusions and Data Viz
-
Yamil Medina: Star Wars Dashboard Ideas
-
Daniel Bolinson: Build a Dynamic Linear Regression Model with Anvil X
-
Will Sutton: What's the strangest thing that inspired a #dataviz?
-
Joris van den Berg: A dashboard that changes with the time of the day
-
Ritesh Bisht: Chat GPT solving Tableau end to end Use Case
-
Alexander Waleczek, Curvediscussion: Becoming Data-Driven through UX - The Power of Empathy
-
Louis Yu, Data Viz Niinja: My First TC experience - #data23
-
Autumn Battani, Make it Make Sense: Tables Aren’t Boring, You Are
-
Nicole Mark: Charts in the wild! Visualizing Florida’s population growth
-
Amy Hodler, The Data Leadership Collaborative: What Data Leaders Should Know About Knowledge Graphs
-
Dawn Harrington, Tech Tips Girl: What Visualizations Should You Use to Display Anomalies?
-
KT, Data Leadership Collaborative: Building a Community to Accelerate Data Culture
-
CJ Mayes: Tableau Data Analyst Exam Reflections (Deborah S & Mehras A)
-
Adam Mico: Cincy TUG Shenanigans with the #DataFam + Michelle Frayman has our Viz of the Week
-
Sarah Bartlett, Sarah Loves Data: Tableau Conference Reflections 2023 #data23
-
Jennifer Dawes, herdata: Conference Reflection #Data23
Team Tableau
-
2023 Iron Viz finalists made earth their viz-ness at Tableau Conference
-
Closing the (ideas) loop: Update re. Tableau product ideas, features & releases
Upcoming events and community participation
-
Iron Viz '23 Quest Trailmix: Iron Viz is the world's largest data visualization competition. Quest on and become a fan!
-
Data Book Club: This spring we'll be reading Avoiding Data Pitfalls: How to Steer Clear of Common Blunders When Working with Data and Presenting Analysis and Visualizations by Ben Jones.
-
TrailblazerDX ’23 Tableau Quest: Leverage the power of data with the world’s leading analytics platform to drive better business decisions.
-
Community Calendar and Upcoming Events: stay up-to-date on the latest Women in Dataviz events and other data visualization-related events. If you'd like to submit an event to the calendar, please fill out this form.
Vizzes
Chimdi Nwosu: Good to Go (G2G) Shipping Dashboard
See the latest Viz of the Day, trending vizzes, featured authors, and more on Tableau Public.
Check out some inspirational vizzes created by the community:
-
Irene Diomi: VizifyAI Women in Parliament
-
George Koursaros: Star Wars Films
-
Chimdi Nwosu: Good to Go (G2G) Shipping Dashboard
-
Felix Schwebel: The Global Learning Crisis | #StudentdataViz2023
-
Rushil Chhibber: Press Freedom - MakeoverMonday Wk 20 2023
-
Jacob Rothemund: Hey Alexa, Play Song Quiz (Remixed Overlay)
-
Jennifer Dawes: Remembering The Wizard of Oz
Community Projects
Back 2 Viz Basics
A bi-weekly project helping those who are newer in the community and just starting out with Tableau. Not limited just to newbies!
Web: Back 2 Viz Basics
Twitter: #B2VB
Week 10: Build a Table
Workout Wednesday
Build your skills with a weekly challenge to re-create an interactive data visualization.
Web: Workout Wednesday
Twitter: #WOW2022
Week 20: Can you build a heat map with bathymetry lines?
Makeover Monday
A weekly social data project.
Web: Makeover Monday
Twitter: #MakeoverMonday
Week 20: Media freedom
Preppin' Data
A weekly challenge to help you learn to prepare data and use Tableau Prep.
Web: Preppin’ Data
Twitter: #PreppinData
Week 20: Dining Hall Debacle
DataFam Con
A monthly challenge covering pop culture and fandoms.
Web: DataFam Con
Twitter: #DataFamCon
April 2023: Kids Month!
EduVizzers
A monthly project connecting real education data with real people.
Web: Eduvizzers
May 2023: 2021 Reported Energy and Water Metrics (Boston)
Games Night Viz
A monthly project focusing on using data from your favorite games.
Web: Games Nights Viz
Twitter: #GamesNightViz
Level 6: The Final Boss
Iron Quest
Practice data sourcing, preparation, and visualization skills in a themed monthly challenge.
Web: Iron Quest
Twitter: #IronQuest
Storytelling with Data
Practice data visualization and storytelling skills by participating in monthly challenges and exercises.
Web: Storytelling with Data
Twitter: #SWDChallenge
May 2023: making or missing the mark
Project Health Viz
Uncover new stories by visualizing healthcare data sets provided each month.
Web: Project Health Viz
Twitter: #ProjectHealthViz
May 2023: WHO’s Global Report on Health Equity for Persons with Disabilities
Diversity in Data
An initiative centered around diversity, equity & awareness by visualizing provided datasets each month.
Web: Diversity in Data
Twitter: #DiversityinData
May 2023: Mental Health Awareness Month
Sports Viz Sunday
Create and share data visualizations using rich, sports-themed data sets in a monthly challenge.
Web: Sports Viz Sunday
Twitter: #SportsVizSunday
January 2023: Is it a Sport or a Game?
Viz for Social Good
Volunteer to design data visualizations that help nonprofits harness the power of data for social change.
Web: Viz for Social Good
Twitter: #VizforSocialGood
Apr 18 - June 6, 2023: World Health Organization (WHO)
Real World Fake Data
Create business dashboards using provided data sets for various industries and departments.
Web: Real World Fake Data
Twitter: #RWFD
Session 5: Diversity Score Card
Data Plus Music
A monthly project visualizing the data behind the music we love!
Web: Data Plus Music
Twitter: #DataPlusMusic
Articles sur des sujets connexes

DataFam Roundup June 2026

DataFam Roundup May 2026

Iron Viz 2026: Read Between the Data
 mai 28, 2026