DataFam Roundup July 28-August 1, 2025


Welcome! Dig into this week's DataFam Roundup—a weekly blog that brings together community content all in one post. As always, we invite you to send us your content—and the DataFam content from your peers that have inspired you! Find the content submission form here.
Community Highlight
To recognize new and consistent Tableau contributors—we’re excited to have a section within the weekly DataFam Roundup called the Tableau Community Highlight. Find out how to get involved.

Karishma Darla, Product Engineer and Data Analyst
California, USA
Karishma Darla is a Product Engineer and Data Analyst who uses Tableau to transform complex data into clear, interactive dashboards that drive business decisions. Her goal is to tell a story with data, enabling users to track key performance indicators, identify trends, and perform "what-if" analysis. She learned Tableau through a combination of self-guided tutorials, hands-on experience at work, and active engagement with the Tableau Community. She also uses Tableau to stay creative and practice new techniques.
Karishma is now deeply involved in the Tableau Community, which she describes as welcoming and inspiring. She is a co-leader of the Data + Women US Northeast Tableau User Group and an active member of several others, motivated by a desire to bring together creativity and logic in the data world and to support other women in tech. She has organized and hosted community events, including workshops and panels, and has engaged with the DataFam at events like Tableau Conference 2025, where her team won a hackathon award. Karishma also shares her knowledge through social media, university workshops, and local networking events, aiming to make data more accessible and empowering for everyone.
Connect with Karishma on Linkedin, X, and Tableau Public.
DataFam Content
-
Dawn Harrington: How it all began - Totally Rad Tableau Podcast
- Rafael Guevara: Wrenches and Workbooks: MediTech Dashboard Deep Dive
-
Jim Dehner: Fun Ways to Tackle 6 Tough Problems
- Brittany Rosenau: Makeover Monday 2025 W31 Walkthrough - European Minimum Wages
-
Nicole Klassen: Charting a New Course: Leading the Teams Behind the Vizzes
- Fi Crocker: Not A Numbers or Data Person? Good. Start Here with Dr Selena Fisk
-
Steve Wood: Tableau Expander Tables - Part 1
- Steve Adams: The Dashboard Crash Test
- Tore Levinsen:
- Deepak Holla:
Visualizations
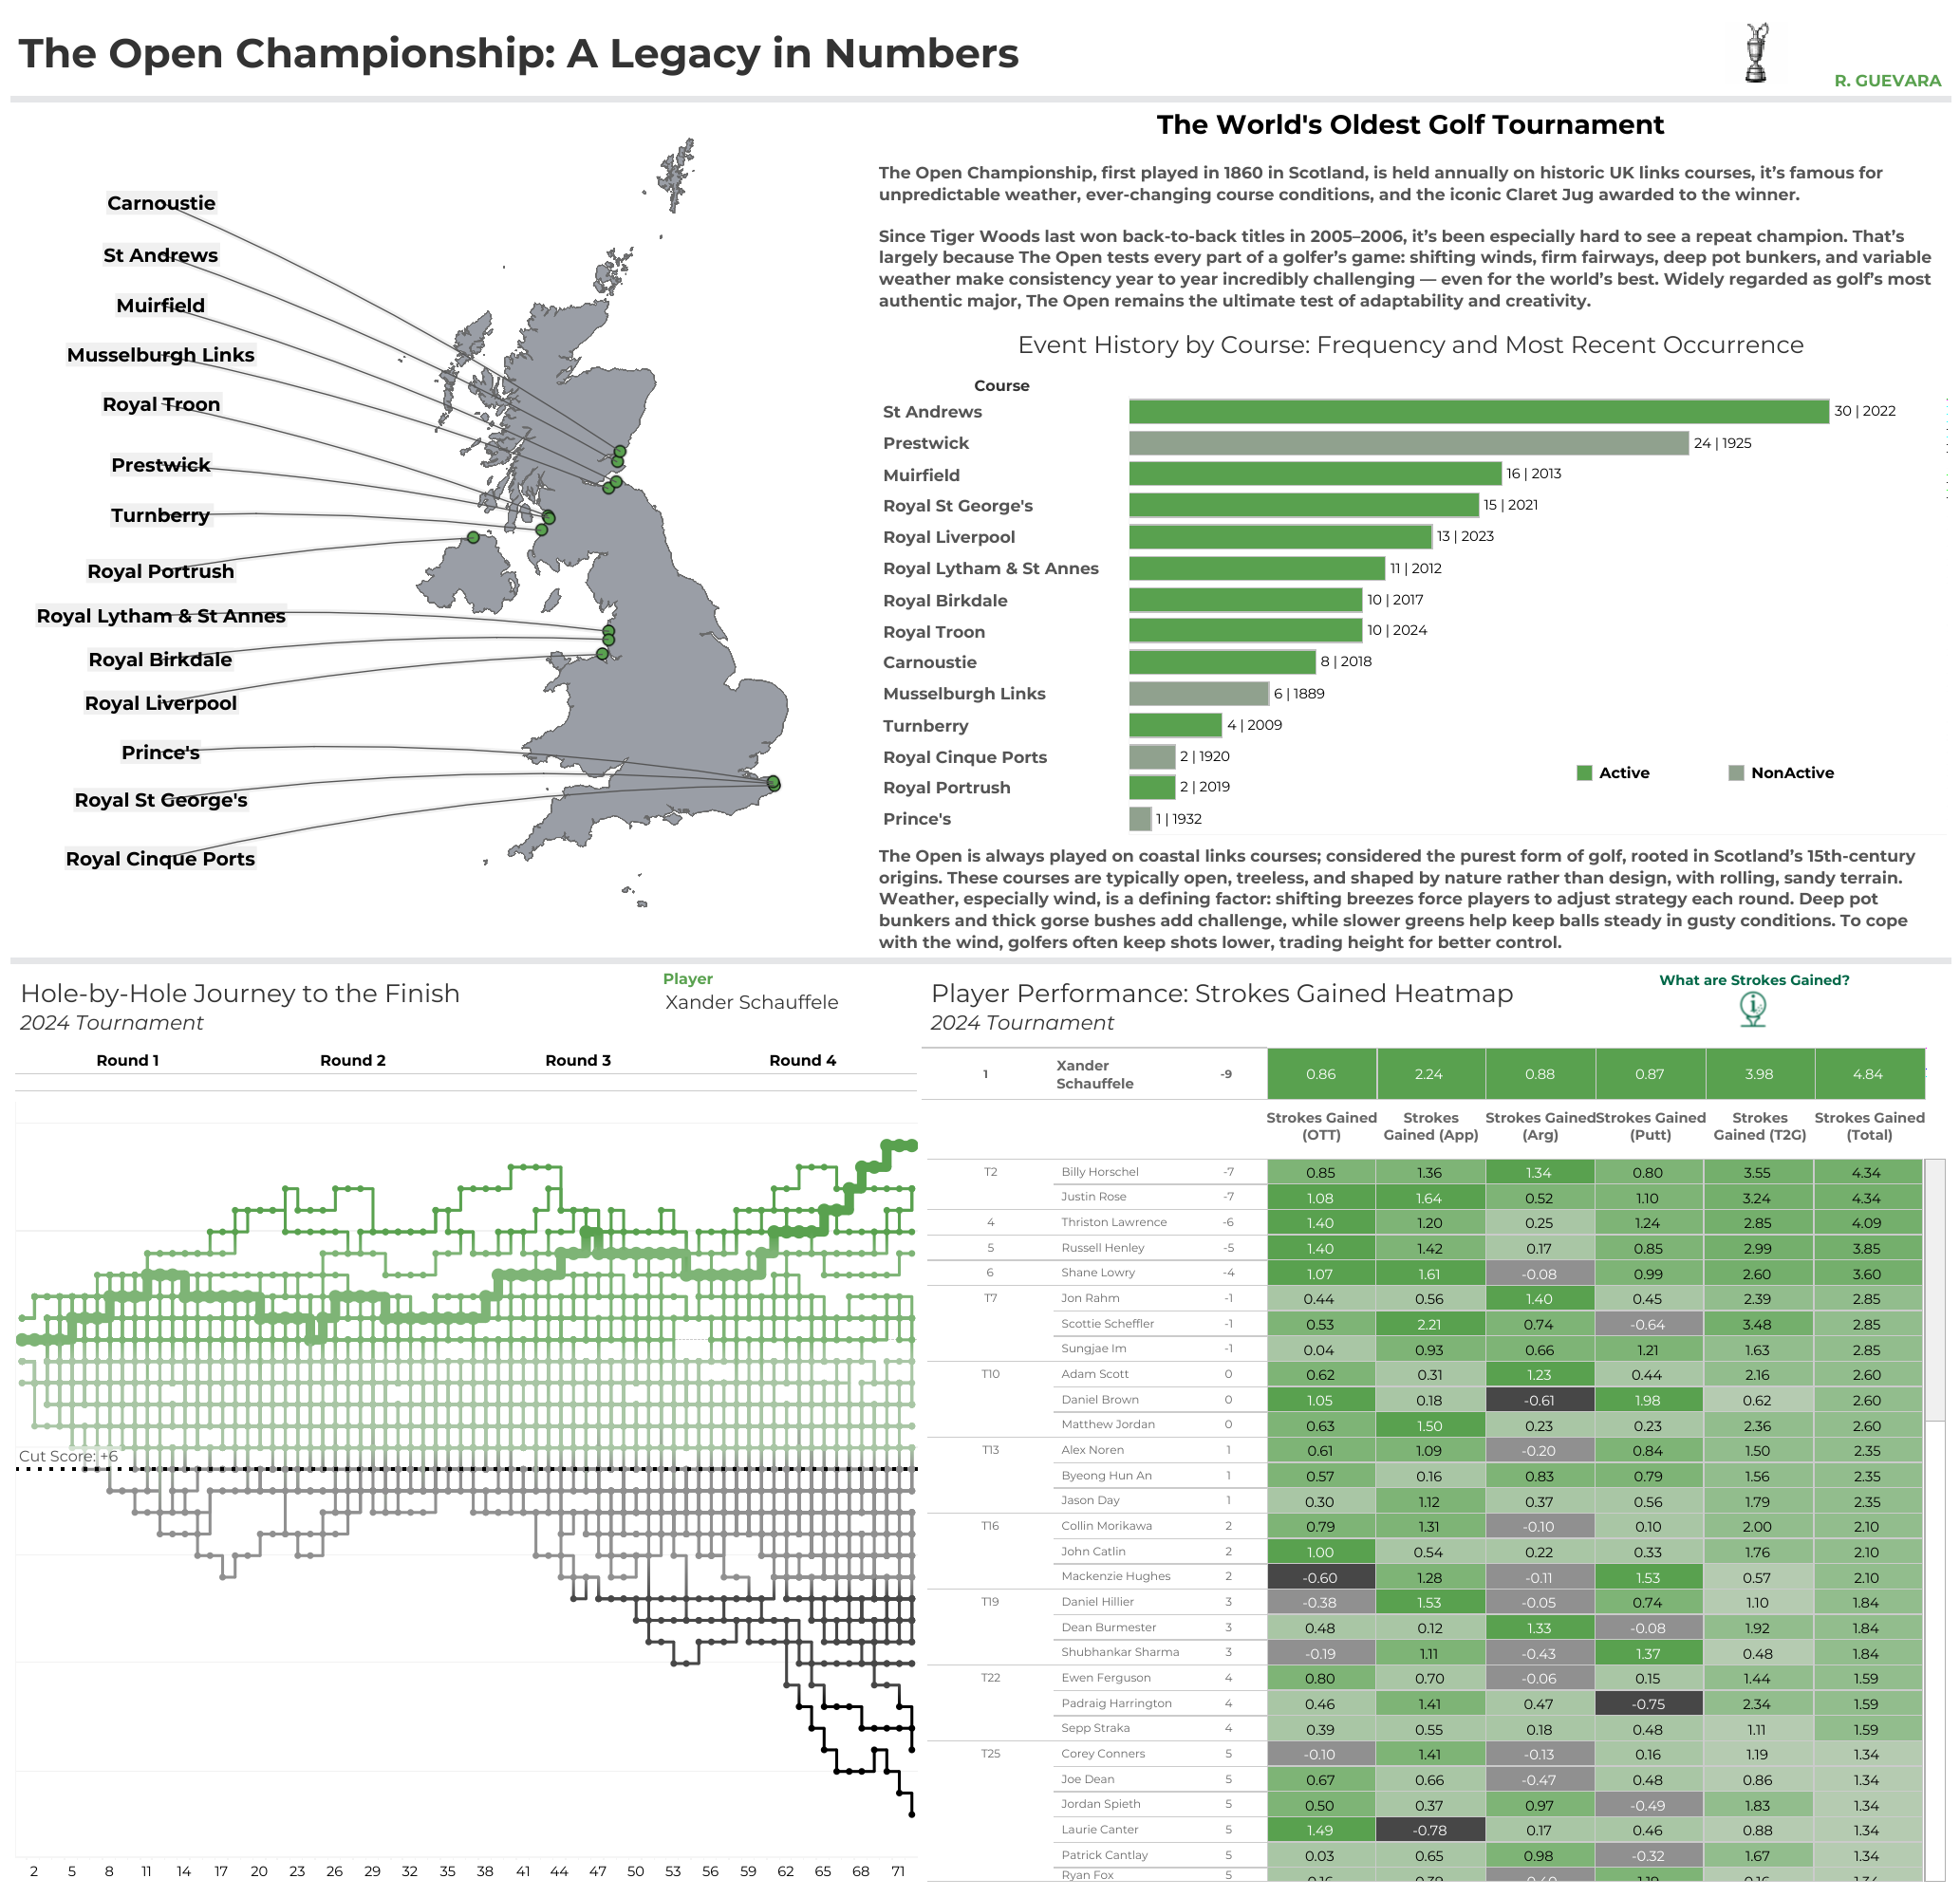
Rafael Guevara: The Open Championship
See the latest Viz of the Day, trending vizzes, featured authors, and more on Tableau Public.
Check out some inspirational vizzes created by the community:
-
Ojoswi Basu: MLB Stats for Smartphone
-
Le Luu: Wow Tracking Challenges
-
Seun Adeyemo: Pacific Resilience
Community Projects
Back 2 Viz Basics
A bi-weekly project helping those who are newer in the community and just starting out with Tableau. Not limited just to newbies!
Web: Back 2 Viz Basics
X: #B2VB
Workout Wednesday
Build your skills with a weekly challenge to re-create an interactive data visualization.
Web: Workout Wednesday
X: #WOW2022
Preppin' Data
A weekly challenge to help you learn to prepare data and use Tableau Prep.
Web: Preppin’ Data
X: #PreppinData
Makeover Monday
Create business dashboards using provided data sets for various industries and departments.
Web: Makeover Monday
X: #MakeoverMonday
Data ChangeMakers
Volunteer to design data visualizations that help nonprofits harness the power of data for social change.
Web: Data ChangeMakers
Visual Climate
Collaborate and share climate data.
Web: Visual Climate
X: #VisualClimate
DataFam Con
A monthly challenge covering pop culture and fandoms.
Web: DataFam Con
X: #DataFamCon
EduVizzers
A monthly project connecting real education data with real people.
Web: Eduvizzers
Games Night Viz
A monthly project focusing on using data from your favorite games.
Web: Games Nights Viz
X: #GamesNightViz
Iron Quest
Practice data sourcing, preparation, and visualization skills in a themed monthly challenge.
Web: Iron Quest
X: #IronQuest
Storytelling with Data
Practice data visualization and storytelling skills by participating in monthly challenges and exercises.
Web: Storytelling with Data
X: #SWDChallenge
Project Health Viz
Uncover new stories by visualizing healthcare data sets provided each month.
Web: Project Health Viz
X: #ProjectHealthViz
Diversity in Data
An initiative centered around diversity, equity & awareness by visualizing provided datasets each month.
Web: Diversity in Data
X: #DiversityinData
Sports Viz Sunday
Create and share data visualizations using rich, sports-themed data sets in a monthly challenge.
Web: Sports Viz Sunday
X: #SportsVizSunday
Real World Fake Data
Create business dashboards using provided data sets for various industries and departments.
Web: Real World Fake Data
X: #RWFD
Data Plus Music
A monthly project visualizing the data behind the music we love!
Web: Data Plus Music
X: #DataPlusMusic
BizViz52
A weekly project centered around designing business dashboards.
Web: BizViz52
X: #BizViz52
Articles sur des sujets connexes

DataFam Roundup June 2026

DataFam Roundup May 2026

Iron Viz 2026: Read Between the Data
 mai 28, 2026