DataFam Roundup August 25-29, 2025


Welcome! Dig into this week's DataFam Roundup—a weekly blog that brings together community content all in one post. As always, we invite you to send us your content—and the DataFam content from your peers that have inspired you! To send us your content, join the Tableau Community workspace on Slack and join the #community-share channel.
Community Highlight
To recognize new and consistent Tableau contributors—we’re excited to have a section within the weekly DataFam Roundup called the Tableau Community Highlight. Find out how to get involved.

Cintra Jaggernauth, Data Analyst
Louisiana, USA
Cintra Jaggernauth is a Data Analyst. She specializes in creating interactive, user-friendly, and automated Tableau dashboards, transitioning static reports into dynamic visualizations. Her journey with Tableau began with an interest in its storytelling capabilities and the ability to create visually appealing dashboards, later appreciating its technical prowess in uncovering data insights quickly. She learned Tableau through a combination of YouTube tutorials, blog articles, and a bootcamp course with Millennials and Data, finding reverse-engineering other workbooks on Tableau Public to be a highly effective learning tool.
Cintra highly values the supportive Tableau Community, particularly on the Forums for in-depth solutions and the willingness of others to share knowledge. She has been involved in various Tableau User Groups like the DataFam Career Pathmakers TUG, Newbies TUG, and Tableau Public TUG. Currently, she shares her Tableau knowledge at work through 1:1 training and internal TUG presentations, aiming to help colleagues become more comfortable and confident with Tableau. Looking ahead, she is excited to experiment with different business dashboard styles and improve her Tableau Prep skills through challenges like Preppin’ Data.
Connect with Cintra on Linkedin, X, and Tableau Public.
DataFam Content
- Dawn Harrington: What are the Highest, Lowest and Median Products?
- Heather Cox: Inspired by Inspiration: Brittany Rosenau unboxes The Barbie Movie | Ep 2 - Unfinished Vizness
- Annabelle Rincon: The Good, the Bad, and the Cheesy : A Tableau Tale 🧀
- Steve Adams: What Counts as an Insight (and Why Most Dashboards Don’t Deliver Them)
- Johan de Groot: Tableau Container Art – 4 examples of formatting dashboards without images
- Tore Levinsen:
- Deepak Holla:
Visualizations
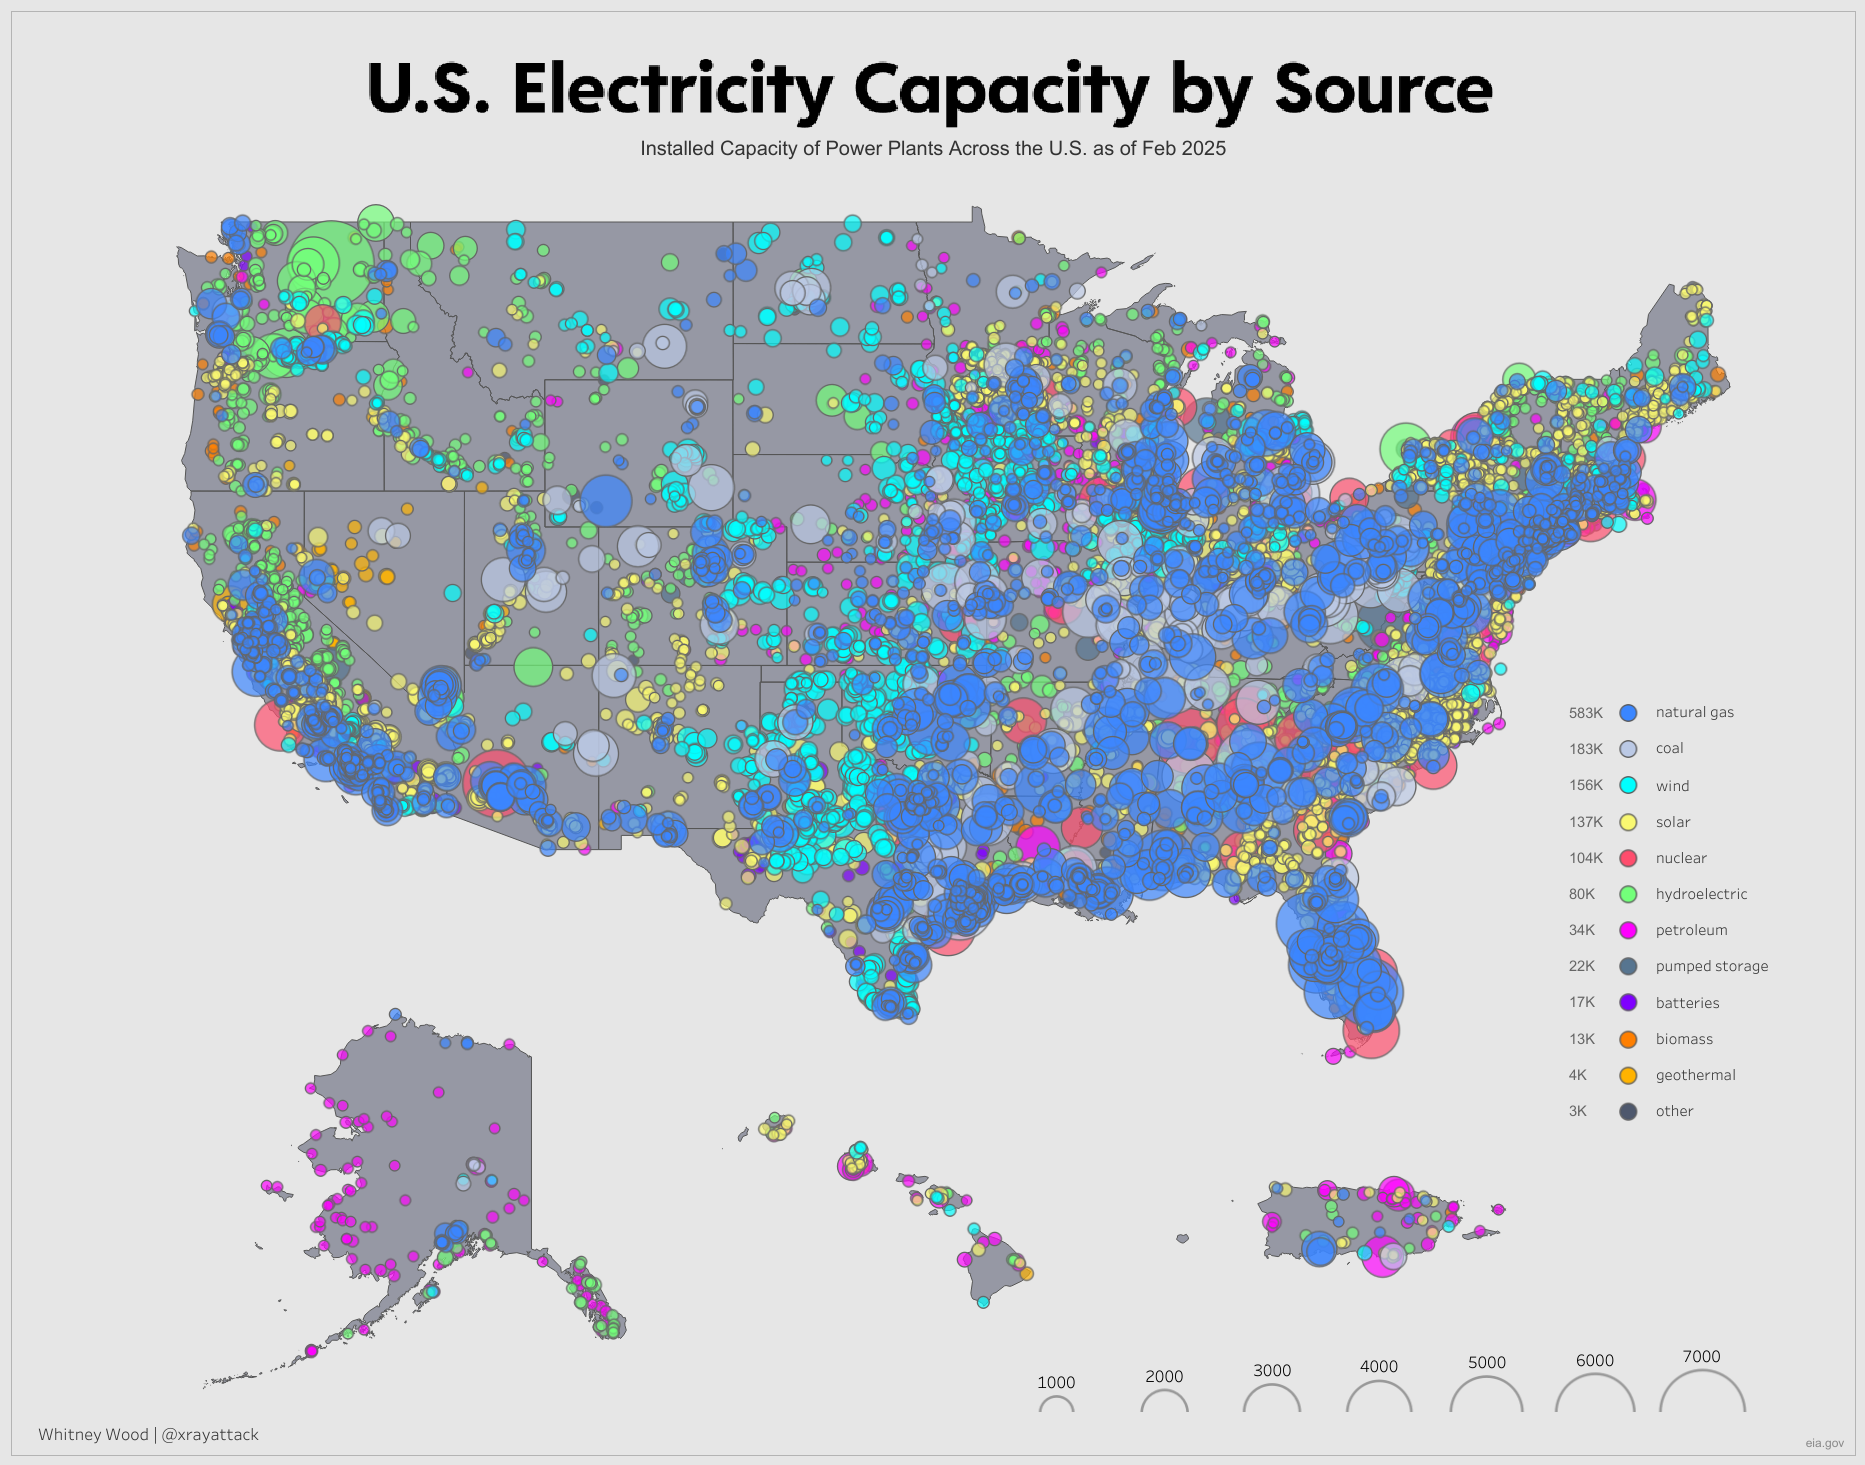
Whitney Wood: U.S. Electricity Capacity by Source
See the latest Viz of the Day, trending vizzes, featured authors, and more on Tableau Public.
Check out some inspirational vizzes created by the community:
- Ojoswi Basu: Smartphone Enabled Sales Analysis
- Iris Sun: Makeover Monday Week 34: UK Unemployment Since 1975
- Timur Muidinov: Tableau Reports Usage
- Tsutomu Ikeda: #VizGames 2025 Qualifying
Community Projects
Back 2 Viz Basics
A bi-weekly project helping those who are newer in the community and just starting out with Tableau. Not limited just to newbies!
Web: Back 2 Viz Basics
X: #B2VB
Workout Wednesday
Build your skills with a weekly challenge to re-create an interactive data visualization.
Web: Workout Wednesday
X: #WOW2022
Preppin' Data
A weekly challenge to help you learn to prepare data and use Tableau Prep.
Web: Preppin’ Data
X: #PreppinData
Makeover Monday
Create business dashboards using provided data sets for various industries and departments.
Web: Makeover Monday
X: #MakeoverMonday
Data ChangeMakers
Volunteer to design data visualizations that help nonprofits harness the power of data for social change.
Web: Data ChangeMakers
Visual Climate
Collaborate and share climate data.
Web: Visual Climate
X: #VisualClimate
DataFam Con
A monthly challenge covering pop culture and fandoms.
Web: DataFam Con
X: #DataFamCon
EduVizzers
A monthly project connecting real education data with real people.
Web: Eduvizzers
Games Night Viz
A monthly project focusing on using data from your favorite games.
Web: Games Nights Viz
X: #GamesNightViz
Iron Quest
Practice data sourcing, preparation, and visualization skills in a themed monthly challenge.
Web: Iron Quest
X: #IronQuest
Storytelling with Data
Practice data visualization and storytelling skills by participating in monthly challenges and exercises.
Web: Storytelling with Data
X: #SWDChallenge
Project Health Viz
Uncover new stories by visualizing healthcare data sets provided each month.
Web: Project Health Viz
X: #ProjectHealthViz
Diversity in Data
An initiative centered around diversity, equity & awareness by visualizing provided datasets each month.
Web: Diversity in Data
X: #DiversityinData
Sports Viz Sunday
Create and share data visualizations using rich, sports-themed data sets in a monthly challenge.
Web: Sports Viz Sunday
X: #SportsVizSunday
Real World Fake Data
Create business dashboards using provided data sets for various industries and departments.
Web: Real World Fake Data
X: #RWFD
Data Plus Music
A monthly project visualizing the data behind the music we love!
Web: Data Plus Music
X: #DataPlusMusic
BizViz52
A weekly project centered around designing business dashboards.
Web: BizViz52
X: #BizViz52
Articles sur des sujets connexes

DataFam Roundup June 2026

DataFam Roundup May 2026

Iron Viz 2026: Read Between the Data
 mai 28, 2026