Answer your investment questions faster with Tableau


Smart investors diversify across multiple managers, custodians, and brokers. But that diversification creates a huge challenge: Bringing data together to get a complete understanding of your portfolio.
Investors seeking to understand the status of their positions must log into multiple portals, download spreadsheets, trim data, and combine them together. It’s a process that can take hours or even days every month. And as each second goes by, the downloaded investment data gets older and older—by the time you get your answers, the data is already out of date. Market volatility only adds to the problem.
How our Treasury teams analyzes its investments
To answer that challenge and many others, Tableau uses Clearwater Analytics to automate the process of aggregating its investment data. Clearwater independently validates and reconciles our positions daily, allowing our Treasury team to focus on managing, analyzing, and reporting on our investments.
In this blog post, we want to share with you how the Tableau Treasury team is bringing data out of Clearwater, analyzing it, and sharing reporting within our business. These dashboards not only help improve how we manage our investments, but also increase trust that our business’s portfolio is being managed within the guidelines of our investment policy.
Three investment dashboards analyzing our Clearwater data
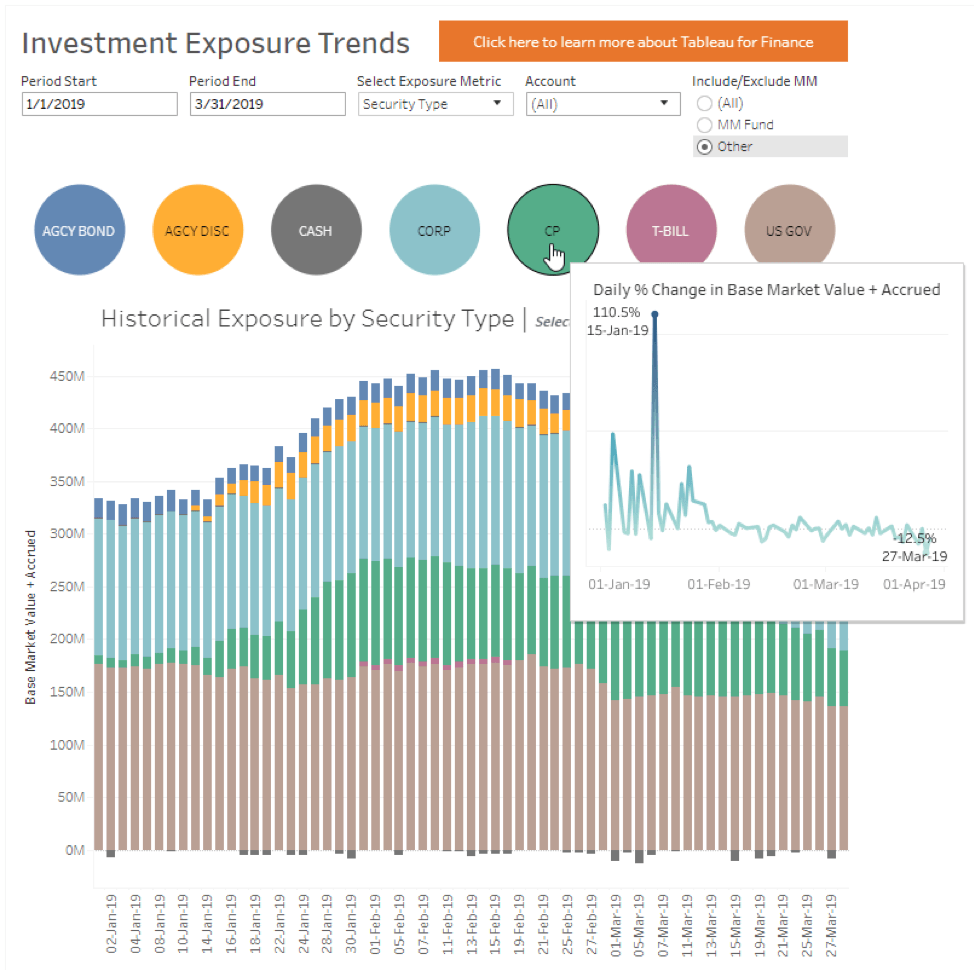
Exposure Trends
One of those analysis and reporting tasks includes creating dashboards that help us understand our exposure to different types of investments. Using just one dashboard, we can see the daily trends for our exposure to different market sectors, security types, asset classes, and balance sheet classes. To drill down into investment details, we can filter out specific investment managers and click to drill down into details about accruals and unrealized gains and losses.
In the example below, it can be powerful to see trends in market value peaking toward the middle of the reporting quarter and that a large portion of value falls under US Government and Corporation securities, or that CP funds were volatile at the beginning of the quarter before leveling off in value. Using this exposure dashboard, we can drill into which accounts and market sectors make up these segments at different peaks of the quarter. These findings can help inform how we invest and offer a great conversation starter about investment exposure with our stakeholders.
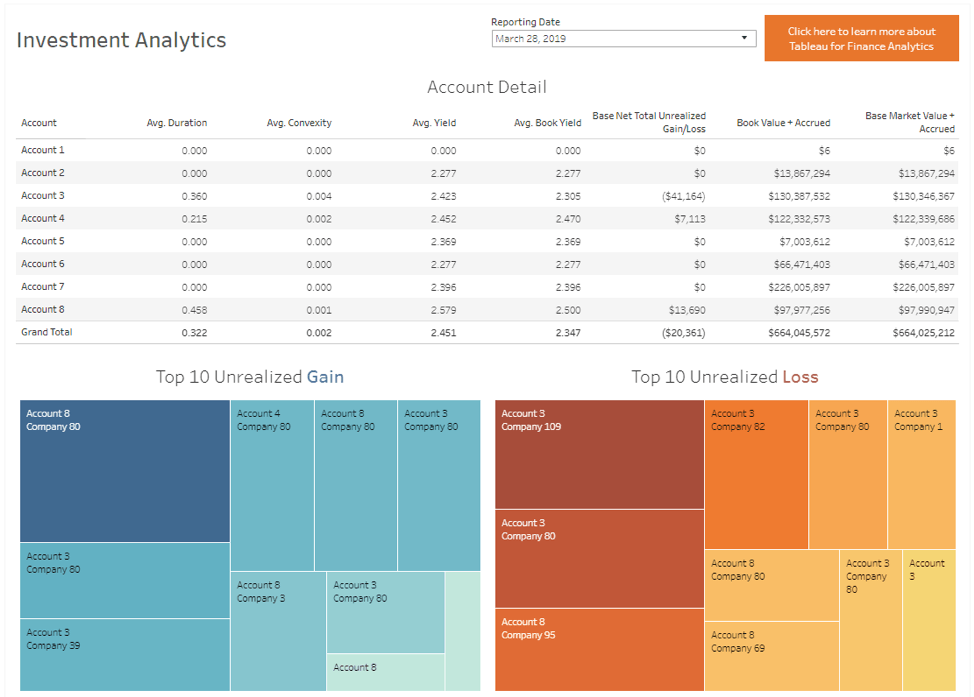
Investment Analytics
Using the same data as we used above to analyze exposure trends, we can also review account metrics including top ten sources of unrealized gains and losses. This view that shows aggregate account metrics as well as the top ten unrealized gains and unrealized losses by security provides a clear visual on what is working and what isn't, allowing our team to focus on key investment areas.
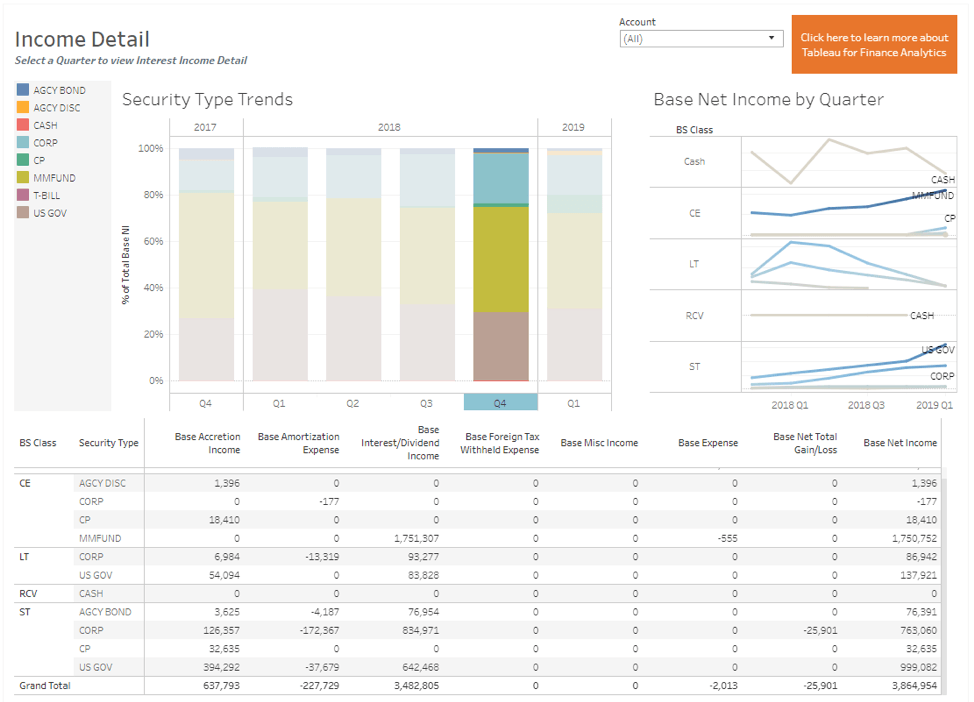
Income Detail
Here at Tableau, our Treasury team also uses Clearwater data to examine what is driving our investment income. In our income detail dashboard, we can review the composition of quarterly interest income by security type as well as understand trends in net income by balance sheet class. By knowing where our investment income is coming from, we can compare different investment funds to determine who is giving us better outcomes. It can be useful to tie these findings back to the trends in our investment and exposure dashboards to get a global view of our investment strategy.
And these dashboards are just the starting point. From there, our Treasury team uses Tableau to:
- Combine Clearwater data with cash position information not included in Clearwater, such as bank statements for a 360-degree view of cash and investments including counterparty exposure analysis
- Blend in contextual data such as industry benchmarks for specific asset classes
- Share performance data with internal stakeholders like our board of directors
- Set data-driven email alerts to let alert us if investment positions need to be re-balanced
How to get started
- Learn more about Clearwater Analytics here; if you’re already using the platform, you can find your data in the GAAP Accounting Income Detail and Balance Sheet reports in Clearwater. (We do this daily to get fresh data.)
- We recommend putting the Clearwater files in a folder and using wildcard unions to aggregate results. Or you can write the data to a database using a data prep software.
- Interact with and download the dashboards featured in this blog post. The Exposure Trends, Investment Analytics, and Income Detail dashboards are all posted to Tableau Public and can be repurposed with your data or quickly modified to fit your needs.
To learn more, watch this short webinar, “How to analyze investment risk,” hosted by the Tableau Treasury team on investment analytics.
Articles sur des sujets connexes
How EMD Serono is improving patient care with personalized, AI-powered insights from Tableau
 septembre 30, 2024

Embedded Analytics: Should you build or buy?
 juin 7, 2022

Data fabric’s value to the enterprise
 mai 11, 2022