Tous les articles de
 Best of Tableau Web
Best of the Tableau Web: October 2013
 novembre 5, 2013
A highlight of tips, tricks, and inspiration for Tableau and data visualization.
 Product
Tableau 8.1 and R
In this 2nd in a series of posts about the upcoming 8.1 release, I get to introduce one of the most exciting new features in Tableau 8.1: R integration. R has been a very popular language among statisticians but in the past few years, it has become the language of choice for a much broader group of data enthusiasts.-
Best of Tableau Web
Best of the Tableau Web: September 2013
octobre 7, 2013
A highlight of tips, tricks, and inspiration for Tableau and data visualization.
 Data
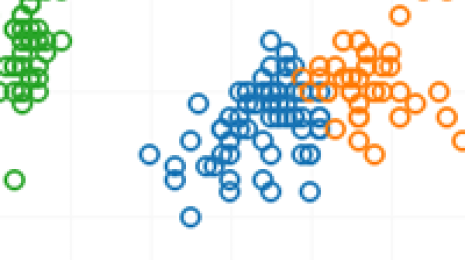
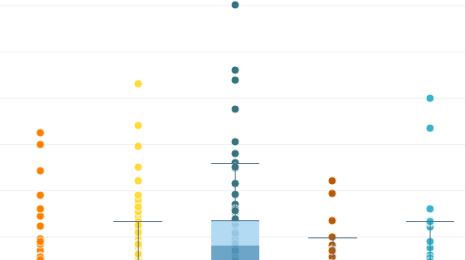
DataTableau 8.1: Sophisticated Analytics for Sophisticated People
 septembre 26, 2013
This is the first in a series of blog posts on the Tableau 8.1 release. With every release we try to provide features that help people answer more questions. Tableau 8.1 is now in beta with a host of new analytical capabilities, from boxplots to one-click percentiles and ranking.
septembre 26, 2013
This is the first in a series of blog posts on the Tableau 8.1 release. With every release we try to provide features that help people answer more questions. Tableau 8.1 is now in beta with a host of new analytical capabilities, from boxplots to one-click percentiles and ranking.-
Best of Tableau Web
Best of the Tableau Web: July 2013
juillet 31, 2013
A highlight of tips, tricks, and inspiration for Tableau and data visualization.
 Tableau Cloud
The power of Tableau, in the cloud
juillet 17, 2013
Ever wished you could easily share analytics with your colleagues? Ever wanted to collaborate on a dashboard with a customer or partner? Or wish you could access and work securely with data on your tablet, without having to VPN into your corporate network? But you couldn’t. Or you could, but didn’t want to download software or spin up an IT project. If so, then today is a big day. Today we’re announcing Tableau Online, a hosted version of Tableau Server in the cloud. It’s the fastest way to get up and running with a complete business intelligence platform. We take care of the infrastructure, you share analytics. It’s that easy.
-
Best of Tableau Web
Best of the Tableau Web: May-June 2013
juin 18, 2013
A highlight of tips, tricks, and inspiration for Tableau and data visualization.
 Tableau Community
Meet Our Customer Speakers for TCC13! (Early bird discount expires Friday)
 mai 30, 2013
If you don't have your ticket yet for the Tableau Customer Conference in Washington D.C., you're gonna want to pick it up before Friday, when the early bird discount expires. In addition to keynotes by Nate Silver, Charles Wheelan and Tableau's co-founders, we can finally announce some of the Tableau customers who will be speaking at TCC about how they use Tableau in their own companies. Alongside household names like LinkedIn and Wells Fargo, you'll have the chance to hear from small- and medium-sized companies and agencies, including AudienceAudit, Manpower Group and the Broad Institute. Read more for a full list of confirmed customer speakers.
mai 30, 2013
If you don't have your ticket yet for the Tableau Customer Conference in Washington D.C., you're gonna want to pick it up before Friday, when the early bird discount expires. In addition to keynotes by Nate Silver, Charles Wheelan and Tableau's co-founders, we can finally announce some of the Tableau customers who will be speaking at TCC about how they use Tableau in their own companies. Alongside household names like LinkedIn and Wells Fargo, you'll have the chance to hear from small- and medium-sized companies and agencies, including AudienceAudit, Manpower Group and the Broad Institute. Read more for a full list of confirmed customer speakers.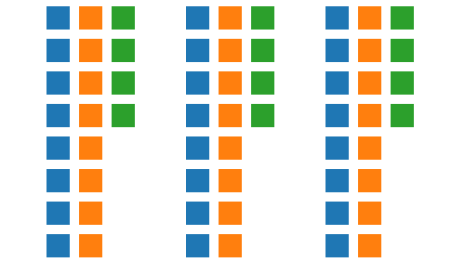 Visualizations
Conseils et astuces : solutions alternatives au calcul du total distinct
 mai 24, 2013
La notion de total distinct est essentielle en analytique, qu'il s'agisse de compter le nombre de patients dans un hôpital, le nombre de transactions uniques dans la vente au détail, ou encore le nombre d'avions dans une flotte. Le calcul de total distinct dans Tableau est très simple, et un clic suffit pour modifier l'agrégation du calcul. Néanmoins, il s'agit également d'un calcul très exigeant, qui prendra plus de temps si les données sont très volumineuses. Je vais vous présenter des solutions alternatives pour obtenir la même réponse qu'avec un calcul de total distinct.
-
Best of Tableau Web
Best of the Tableau Web: April 2013
mai 7, 2013
A highlight of tips, tricks, and inspiration for Tableau and data visualization.
 Data
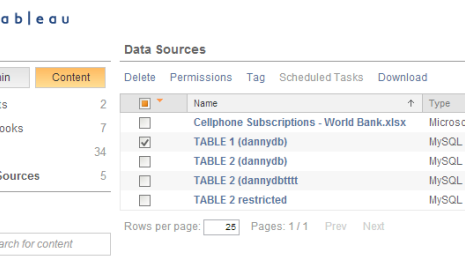
DataUnleashing the Tableau Data Server
 mai 3, 2013
Tableau Server has many built in features to promote data exploration, collaboration, and security. The Data Server is arguably the most powerful of these tools but is commonly overlooked and underutilized. Answer these questions to see how the Data Server can save you time and increase productivity. • Are you struggling to manage and update many large extracts while removing duplicates? • Do you want to refresh your extracts once and automatically update your workbooks? • Do you want to provide centralized management of your metadata? The ability to author a calculation once and share it with everyone, creating a standardized definition for each field? • Are you tired of having to deploy database drivers on each users local machines? • Do you want to simplify how your users access data stored in your databases? If you found yourself replying 'yes' to any of these questions, then it’s time to unleash the Data Server.
mai 3, 2013
Tableau Server has many built in features to promote data exploration, collaboration, and security. The Data Server is arguably the most powerful of these tools but is commonly overlooked and underutilized. Answer these questions to see how the Data Server can save you time and increase productivity. • Are you struggling to manage and update many large extracts while removing duplicates? • Do you want to refresh your extracts once and automatically update your workbooks? • Do you want to provide centralized management of your metadata? The ability to author a calculation once and share it with everyone, creating a standardized definition for each field? • Are you tired of having to deploy database drivers on each users local machines? • Do you want to simplify how your users access data stored in your databases? If you found yourself replying 'yes' to any of these questions, then it’s time to unleash the Data Server. Visualizations
Expanding beyond 16 columns without header concatenation
Header Concatenation: This was a new problem for me. Heck, it was a new word for me up until recently. Janet Shen, one of the incredible Viz Magicians from Tableau Professional Services sent me a great "How To" guide for overriding our default settings and I couldn't wait to share it. The useful content is ALL her. The silliness is all me. Hope you find this as helpful as I did! Click inside to get the step-by-step tutorial.