
Mapping your data
Try Tableau for free See it in action
Full-version trial. No credit card required.
Geospatial data surrounds us. We track our morning runs, our route to work or the newest local restaurant, even our dog-walking routes. Whether you plot your personal or business data, if you want to analyse it geographically, using a map is best. Instead of looking to mapping software, consider a self-service analytics platform to get the most value from your geospatial data and so that you and others quickly arrive at the “where” as well as the “why”.
Add mapping to your visual analytics toolbox now!
Put your data in context with interactive maps
Using geographical mapping, you immediately orient your audience to the information and unlock answers to different spatial questions. You might wonder, does a product category in my business outperform others in a territory, what devastation have natural disasters recently left in their wake, or what surface streets have the most congestion during my commute (so I can avoid them)?
Explore the dashboard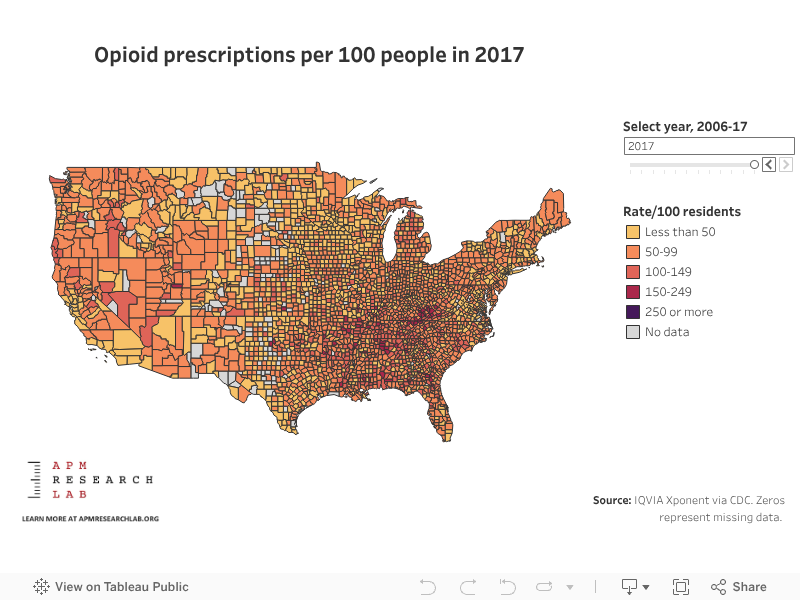
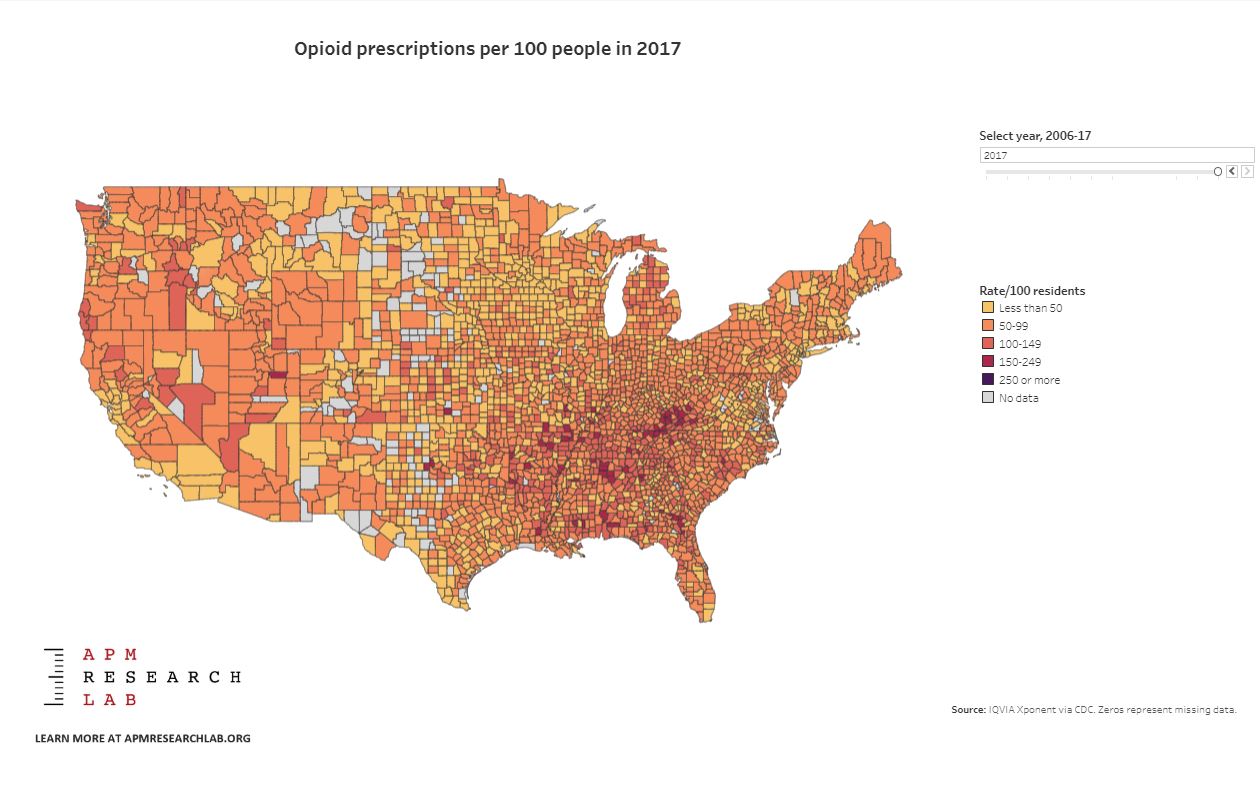
Choose the right map for your analysis
Maps come in many formats to suit the goal of your analysis; there’s choropleth, flow, heat, or point distribution maps, to list a few. Make sure the format you choose offers the right amount of context for your visualisation so viewing audiences find it easy to consume.
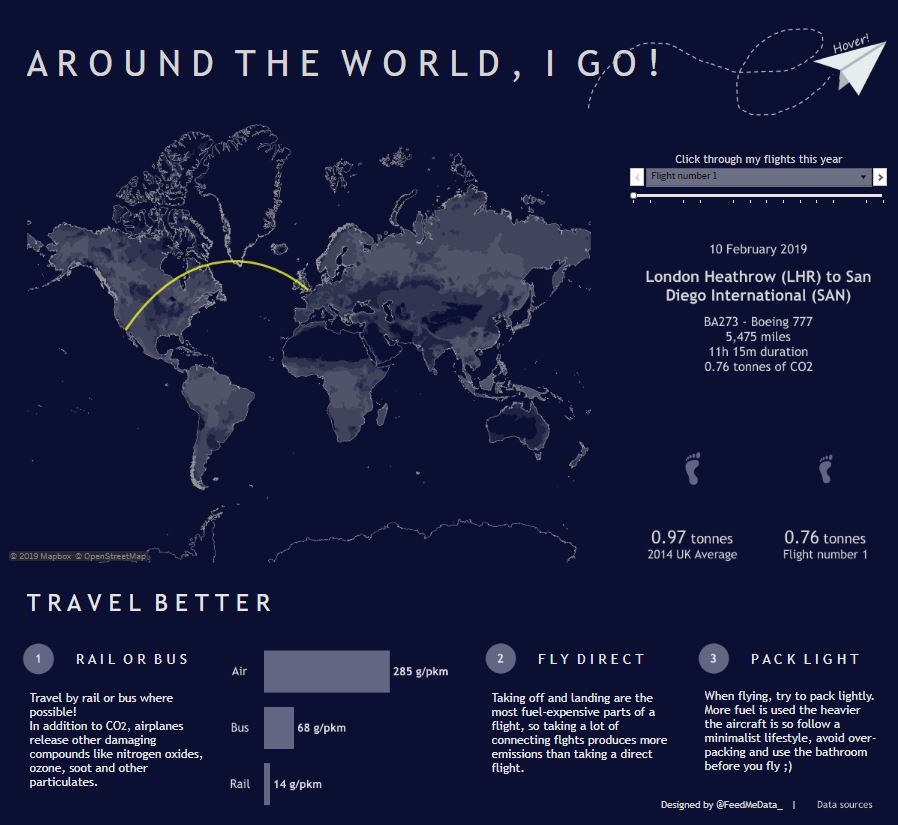
Be creative with formatting your maps
Mapped data doesn’t have to be confined to a box, because geographical features are rarely a nice rectangle in shape. Using different layouts and thoughtfully designing a map can help illuminate the story of your data and draw viewers’ attention to key details.
Explore the dashboard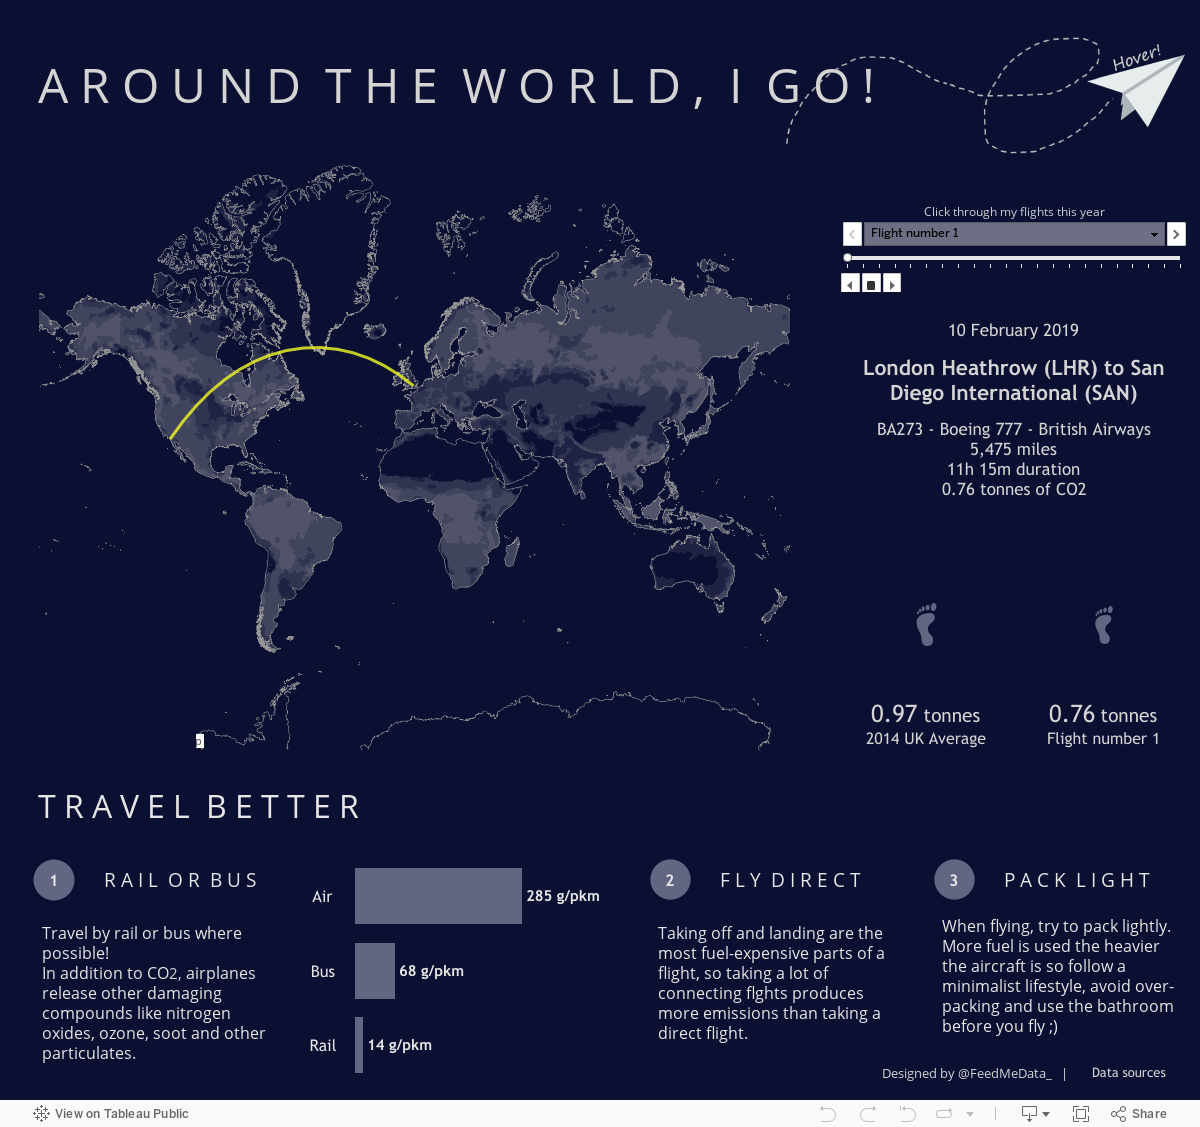
Easily tackle your geospatial analysis
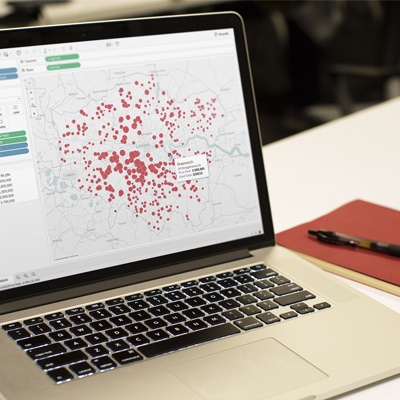
Tableau's spatial file connector allows you to easily connect to and join Esri Shapefiles, KML, MapInfo tables, GeoJSON files and other forms of geospatial data so you can create point, line or polygon maps. When you don’t have spatial files, you can find open data from organisations like census.gov, data.gov, the US Energy Information Administration and the London DataStore.
We plotted stores on a map in Tableau. Animating it over time as stores closed for remodelling, we saw sales grow for surrounding stores and realised spending more money on restaurant remodelling has really helped the business.


Full-version trial. No credit card required.
Tableau is trusted by:


