Back to US Election 2020 Data Home
COVID-19 concerns
Asking respondents the following four questions:
How worried are you that you or someone in your family will be exposed to the coronavirus?
How worried are you about the outbreak of coronavirus in the United States?
How worried are you that the coronavirus outbreak will have a negative economic effect on the United States?
How worried are you that the coronavirus outbreak will have a negative economic effect on the global economy?

Survey methodology

These data come from a series of SurveyMonkey polls collected continuously since June 1, 2020, with about 35,000 responses collected every week. Respondents were selected from the more than 2 million people who take surveys on the SurveyMonkey platform each day.
Data have been weighted for age, race, sex, education, and geography using the Census Bureau’s American Community Survey to reflect the demographic composition of the United States age 18 and over. Depending on the exact visualization and any filters selected, other factors—like vote registration or state—are also taken into account.
Visualization best practices

The small-multiple tile map is a powerful way to compare the opinions of respondents over a large set of distinct geographies—in this case, the states. Paired with the line charts showing trends over time, users have the ability to track changing sentiment and compare the insights with public opinion in their own state.
“In this view, it’s easy to see that the patterns of concern vary significantly by state, and as we break the responses down further by demographic groups we are able to get a good look at just how big those differences are.” —Laura Wronski, Research Science Manager at SurveyMonkey
Learn how to build line charts and small multiple maps in Tableau.
Explore more Election 2020 vizzes
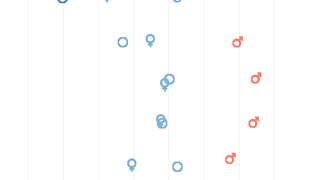
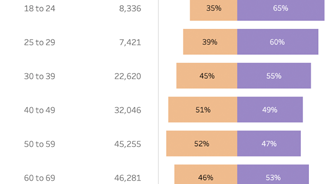
Candidate preference demographics
Explore support for Biden or Trump among different groups of voters.
Vote by mail
Asking respondents about the likelihood that they will vote by mail in this election cycle.
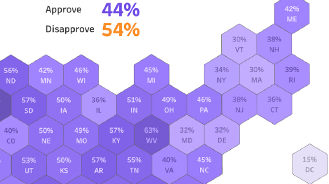
Job performance approval
Asking respondents about their perceptions of how different parts of the government have responded to the COVID-19 crisis.
Recommended content
