การสำรวจข้อมูลแบบไร้ขีดจำกัดและเริ่มต้นการค้นพบตอนนี้
เริ่มต้นทดลองใช้งาน Tableau ของคุณฟรี
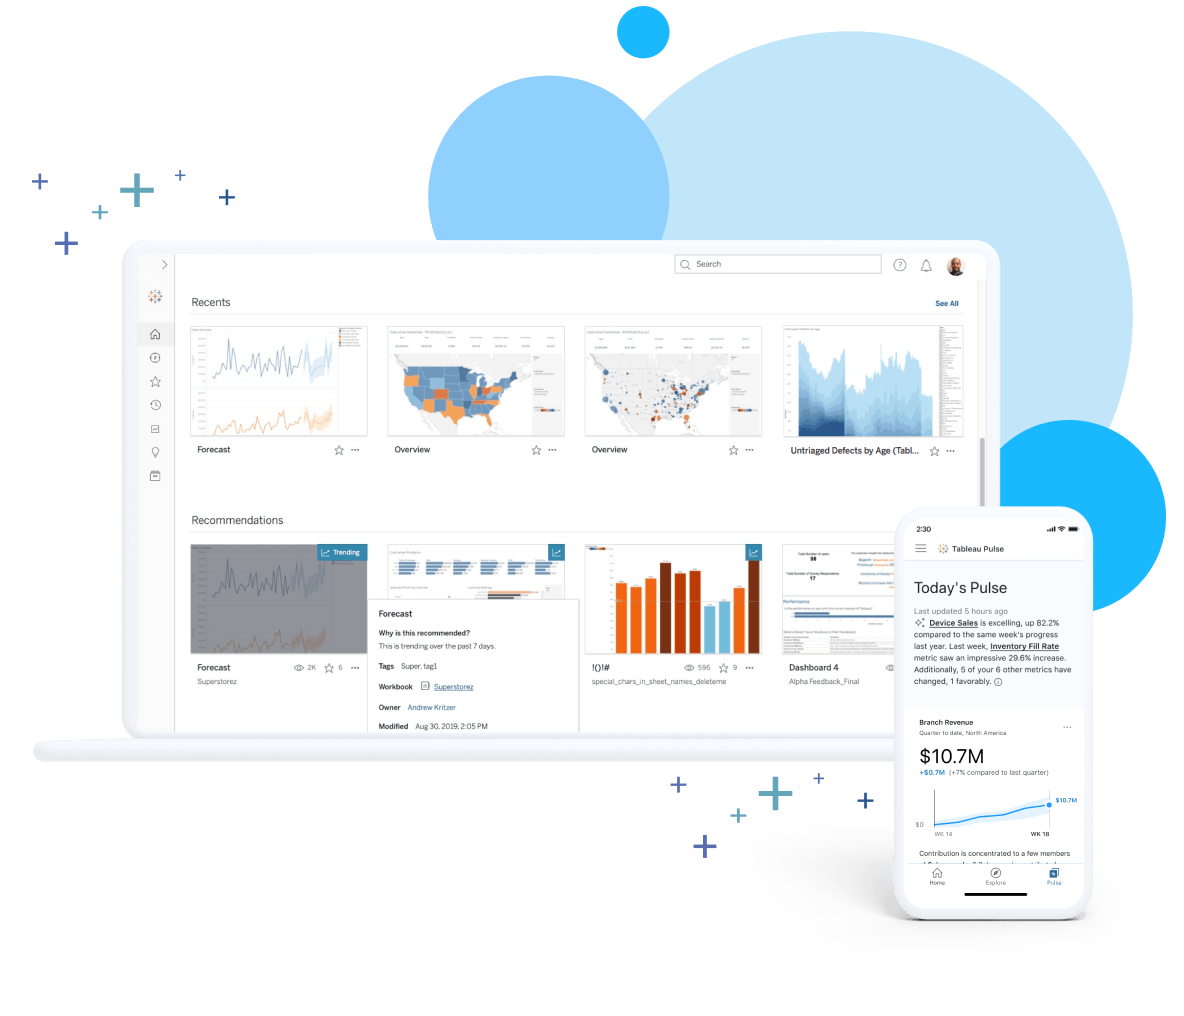
สร้าง แก้ไข แบ่งปันภาพข้อมูลในระบบคลาวด์
จัดเตรียม เชื่อมต่อ และจัดการข้อมูลของคุณได้จากทุกที่
วิเคราะห์ไปพร้อมกับทีมของคุณ
Tableau Cloud Trial ของคุณประกอบด้วย Prep Builder, Data Management และ Tableau Pulse
สร้าง แก้ไข แบ่งปันภาพข้อมูลในระบบคลาวด์
จัดเตรียม เชื่อมต่อ และจัดการข้อมูลของคุณได้จากทุกที่
วิเคราะห์ไปพร้อมกับทีมของคุณ
Tableau Cloud Trial ของคุณประกอบด้วย Prep Builder, Data Management และ Tableau Pulse
คลิกด้านล่างเพื่อลงทะเบียนบัญชีของคุณแล้วเริ่มทดลองใช้งานฟรีได้เลย
*การทดลองใช้งานของคุณไม่รวมการเข้าถึง Tableau Desktop หากคุณสนใจทดลองใช้งาน Tableau ภายในเครื่องคอมพิวเตอร์ของคุณ ให้พิจารณาทดลองใช้งาน Tableau Desktop
วิธีอื่นๆ ในการทดลองใช้งานและสำรวจแพลตฟอร์ม Tableau

วิเคราะห์ + ค้นพบ
Tableau Desktop
สร้างการคำนวณ มุมมอง และแดชบอร์ดที่มีประสิทธิภาพภายในเครื่องคอมพิวเตอร์ของคุณ

จัดเตรียม + จัดระเบียบ
Tableau Prep Builder
รวม กำหนดรูปแบบ และจัดระเบียบข้อมูลของคุณด้วยความแม่นยำและมั่นใจ

ใช้งาน + จัดการ
Tableau Server
ทำงานร่วมกันและแบ่งปันแดชบอร์ดโดยใช้เซิร์ฟเวอร์ในสถานที่ของคุณเอง
หากเป็นผู้เรียนหรือผู้สอน ดาวน์โหลด Tableau ฟรี
เรียนรู้เพิ่มเติมด้วยโปรแกรมวิชาการ Tableau
ทดลองใช้งานและสำรวจแพลตฟอร์ม Tableau
วิเคราะห์ + ค้นพบ
Tableau Desktop
สร้างการคำนวณ มุมมอง และแดชบอร์ดที่มีประสิทธิภาพภายในเครื่องคอมพิวเตอร์ของคุณ
จัดเตรียม + จัดระเบียบ
Tableau Prep Builder
รวม กำหนดรูปแบบ และจัดระเบียบข้อมูลของคุณด้วยความแม่นยำและมั่นใจ
ใช้งาน + จัดการ
Tableau Server
ทำงานร่วมกันและแบ่งปันแดชบอร์ดโดยใช้เซิร์ฟเวอร์ในสถานที่ของคุณเอง
หากเป็นผู้เรียนหรือผู้สอน ดาวน์โหลด Tableau ฟรี
เรียนรู้เพิ่มเติมด้วยโปรแกรมวิชาการ Tableau