
Improving Services Through Data Visualization and Faster Analysis
Tableau Implementation Makes Data-driven Decisions the Norm
A Big Step Towards a Future of Customer Device Stability
Background to Implementation
Long-standing Goal of Streamlining Analysis of Log Data for Printing Equipment
FUJIFILM Corporation Graphic Communication Business Division’s primary products include the Jet Press series of inkjet digital printers, widely used at printing companies and elsewhere, as well as commercial printing equipment and related solutions. The Graphic Communication Business Division’s daily operations include research and development of these products, technical evaluations, and after-sales services.
In these businesses, collection and analysis of usage data and error data from clients’ printing equipment is essential. In the 2010s, engineers in the Graphic Communication Business Division began utilizing data in development and preventive maintenance by downloading log data stored on dedicated websites and using Excel macros to analyze it.
However, those efforts ran into many issues. Kosuke Taguchi, Chief of the Service Solutions Group in the Graphic Communication Business Division, reflected on that era as follows.
“The conventional process required around an hour to download log data for one piece of printing equipment, then another hour to import that into Excel and create a PDF visualization. The inconvenience of the process made it extremely unpopular. Building and managing software for data collection and analysis cost tens of millions of yen for waterfall-style development, then tens of millions of yen again to make improvements. We always had a desire to free ourselves from that state of affairs using BI tools.”
Tableau Implementation and Operation
Streamlining Operations Through Faster Data Collection and Visualization
The number of FUJIFILM staff using Tableau began to increase internally around 2015. In 2019, FUJIFILM decided to deploy Tableau with the aim of transitioning from traditional BI to self-service BI. Latching on to this trend, the Graphic Communication Business Division also began the full-fledged implementation and utilization of Tableau.
In around four months, the Graphic Communication Business Division went from considering Tableau implementation to initiating rollout, and they immediately set to work visualizing log data for their main product, Jet Press inkjet digital printers. Hiromichi Watanabe of the Service Solutions Group described it as follows.
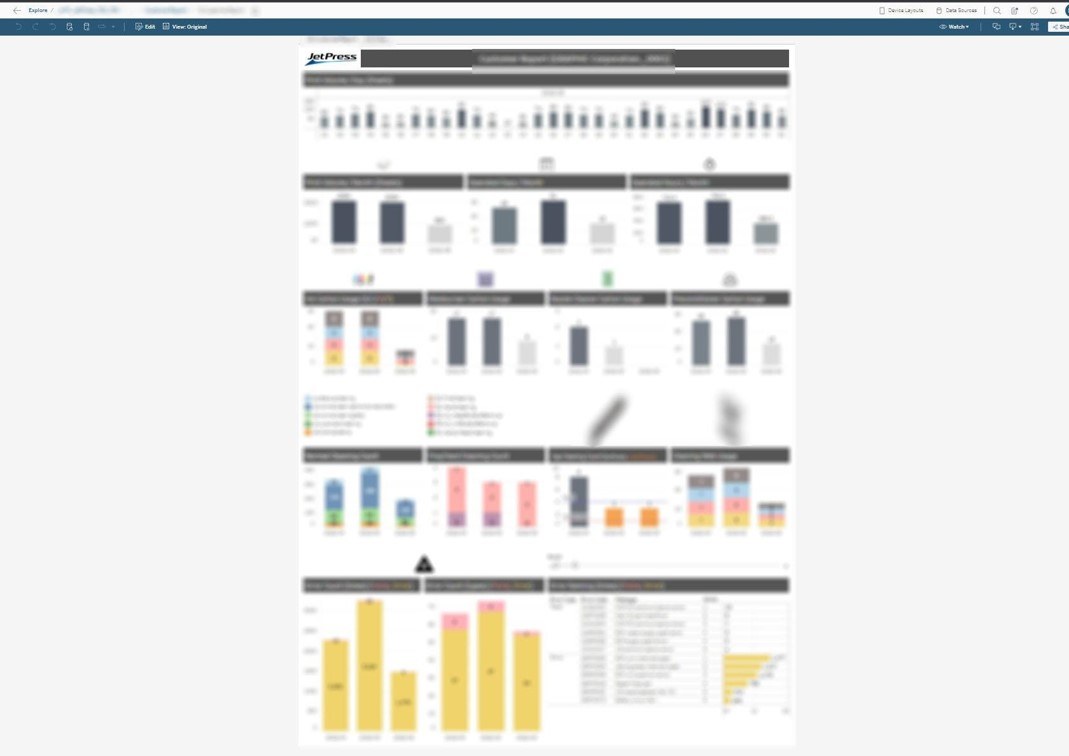
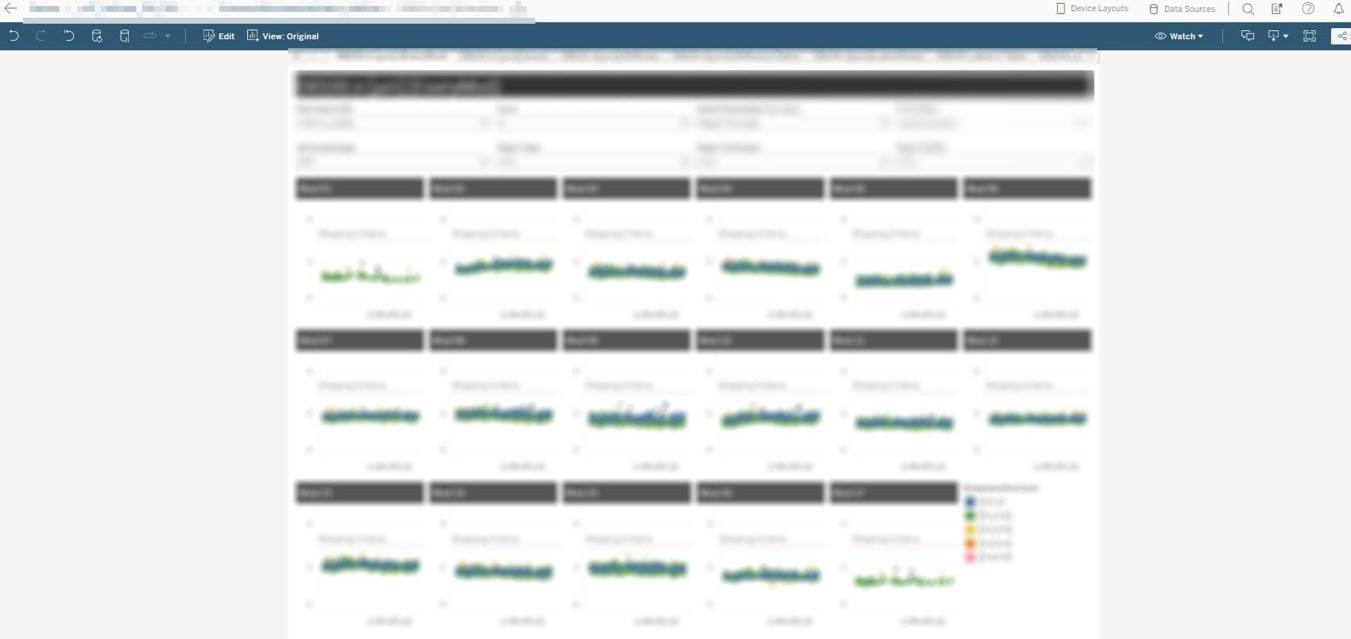
“We pulled printing equipment log data from servers and connected to Tableau via Tableau Bridge for visualization and analysis. This log data included how much ink customers used, the size and thickness of paper used, how many sheets were printed, and any errors that occurred. Using Tableau improved the speed of data access and visualization tremendously compared to our conventional systems.”
Kazumasa Hattori of the DS Quality Assurance and Services Group in the Graphic Communication Business Division described Tableau’s usefulness in after-sales services as follows.
“In the past, staff were dispatched for repairs whenever a customer’s printing equipment broke down, which both took time and incurred personnel costs. We had been collecting log data from printing equipment since around 2010, but we were not making good use of it. With Tableau, we were able to rapidly analyze data to pick up predictors of breakdowns and act to prevent breakdowns during regular on-site maintenance, and this helped us reduce customers’ equipment downtime.”
Why Tableau?
Intuitive Controls and High Degree of Freedom in Viz Creation
One of the reasons Taguchi gives for deciding on Tableau is its intuitive control scheme.
“Even without looking at a manual, I could easily figure out how to make Tableau do what I want. The control scheme is very intuitive. That simplicity and accessibility were attractive to us.”
Hattori also pointed to the degree of freedom possible in Viz creation as another reason for choosing Tableau.
“Some of the major benefits of Tableau are that you can create beautiful visualizations (Viz) on your own and easily make changes. Moreover, anyone can view the data as long as they have a license, and you can transmit information through either regular broadcasts or alert functionality. I am really fond of how easy it is to share information and the hands-off functionality.”
Other factors behind the decision to implement Tableau included the fact that Tableau can handle much greater data volumes than Excel, and that once a Viz is created, there is no need to re-do it even if more data is added. Moreover, Tableau is feature-rich and frequently receives updates that add more features, plus it is capable of deep, multilateral data analysis.
Tableau’s most attractive elements are its intuitive controls and the high degree of freedom in Viz creation. Another big advantage is how easy it is to share data. With Excel, it is difficult to tell which data is the most recent, but links in Tableau make the latest data clear at a glance.

Benefits of Tableau Implementation
Dramatically Reduced Man-hours, New Initiatives Feasible
Hattori described the quantitative benefits of Tableau Implementation as follows.
“With traditional BI, the Software Department was needed to develop or revise even one Viz, and this meant that necessary lead times were on the order of several weeks. However, now it only takes an hour to create or revise a Viz, and we already have hundreds of visualizations available.”
Another big benefit is that Tableau reduces the amount of time it takes to go from collecting the data to visualizing it, which enables rapid analysis, said Watanabe.
“Since printing equipment produces a lot of data, it used to take a tremendous amount of time to collect and import that data. For example, it is necessary to collect and analyze billions of lines of data on inkjet printheads, but with Tableau you can produce a list of results of such calculations with the press of a button. This alone saves roughly 250 hours of work per year.”
Although the quantitative benefits are wonderful, Taguchi emphasized that even more important was how Tableau enabled initiatives that were previously impossible. After deploying Tableau, the Graphic Communication Business Division proceeded to launch one new initiative after another.
“One such initiative was optimizing our parts inventory. There is massive variety and volume in printing equipment parts. With our conventional systems, it took a lot of time to determine what parts inventories were in which areas across the globe, and there was a problem with disparities in inventories from location to location. Tableau enables us to visualize the current status of inventories so we can have locations coordinate and correct their inventories together.”
For example, if personnel in charge of after-sales service need to head out to a customer location, they can look up data on the site’s equipment status before departure and bring along the appropriate parts. I think there is absolutely this dimension whereby individuals are more mindful of basing their decisions on data.

Future Developments
Big Step Towards a Future of Active Utilization of BI by Individuals
“Benefits like the more rapid inkjet printhead analysis mentioned earlier have a tremendous impact if they are possible, but things in this area were long thought to be impossible. The fact that Tableau suddenly enabled us to do these things was so surprising that everyone was a bit taken aback. It was from that point that everyone accepted this new tool called Tableau all at once. This was a true breakthrough, breaking through the barrier people had built up in their minds.”
Having made the comments above, Taguchi expects even more Tableau utilization to come in the future.
“The successful example of the Jet Press did away with barriers to asking for certain kinds of data from personnel responsible for new models of products, as we say that we want to do the same thing with the new models that we did with the Jet Press. Moreover, we also get a lot of constructive comments from everyone telling us what new things they want us to do with Tableau. I really feel like we are taking big strides into the future we always envisioned in which each and every member utilizes data more and more to keep customers’ equipment running stably across the globe.”
In the future, we expect to introduce digital twins such that live data can be processed at ultra-high speeds and the operational status of equipment can be monitored using tablets or other devices in real time. I expect this would enable us to rapidly fix equipment remotely, further improve the performance of customers’ equipment, and dramatically improve the efficiency of after-sales service.