

Cheil Worldwide: Connecting Data and Creativity to Set New Standards in Marketing Operations
Automating 80-90% of Data Processing Time to Enhance Marketers' Focus on Core Tasks
Standardizing Dashboards for Consistent Data-Informed Decision Making
Balancing Security and Accessibility with Token-Based Authentication
Cheil Worldwide, a leading marketing agency in South Korea, has integrated and maximized operational efficiency by adopting Tableau. By automating repetitive data processing tasks and standardizing data across the organization, they have built the 'Cheil Optimizer' solution, enabling marketers to focus more on their core tasks and fostering a data-driven collaboration culture. Here’s how Cheil Worldwide is transforming its marketing operations with data.
About the Company
Cheil Worldwide is a representative marketing agency in South Korea, providing all necessary solutions for marketing activities. They aim to create the best consumer experience, known as 'Connected Experience,' by organically combining three core competencies: Data, Creativity, and Technology. To achieve this, they have established the 'DnA (Data & Analytics) Center' and the 'Digital Tech Department' to manage data-driven marketing performance and support clients with the latest technology solutions.
The Challenge
The Hidden Challenges in a Flood of Data
In the digital marketing environment, ads are executed in real-time, and vast amounts of data accumulate daily. Marketers need to analyze this data to determine the efficiency of different ad channels, materials, and targets and optimize budgets accordingly. However, Cheil Worldwide's marketers faced a significant challenge: they spent 80-90% of their time and resources on data connection, refinement, storage, and extraction before even starting the actual data analysis.
Additionally, various marketing teams and overseas branches used different forms of data, and their core performance indicators (KPIs) and visualization methods varied. Creating numerous dashboards to meet each team's individual needs was inefficient, and it was difficult to analyze performance and develop strategies from a unified perspective.
Seung-hwan Im, a professional at Cheil Worldwide's DnA Center, explained this situation: "The biggest challenge was that too much time and resources were spent on data processing before analysis." He emphasized, "Our primary goal was to minimize the resources spent on data processing so that marketers could focus on optimizing marketing performance."
Marketers' biggest concern was that too much time and resources were spent on data processing before analysis. Therefore, we focused on minimizing the resources spent on data processing in the existing workflow, allowing marketers to concentrate on optimizing marketing performance.
How Tableau Helps
Cheil Worldwide's Dream Partner: Tableau
Cheil Worldwide chose Tableau Cloud as the optimal BI (Business Intelligence) solution to integrate their fragmented data environment and build an efficient decision-making system. They considered four key criteria during the evaluation of various BI tools.
- Flexible and Intuitive Visualization: To meet the diverse reporting needs of different teams, Tableau's drag-and-drop interface, along with advanced features like calculated fields, conditional analysis, and user pattern analysis, was essential.
- High-Volume Data Processing Performance: Given the real-time accumulation of numerous logs and metrics in digital marketing, Tableau's high-speed processing capabilities based on the Hyper engine and its compatibility with multiple data sources like Snowflake were crucial.
- Secure Environment: Handling sensitive data for various teams and clients required robust user permission control and access restriction features. They also considered scalability, including API integration and authentication systems, and the advantage of being able to install Tableau on an independent server.
- Collaboration-Focused Efficient Workflow: After the solution was made public, it was important that multiple users could work simultaneously, share easily, and collaborate in a team-based environment.
Based on these four criteria, we reviewed various BI tools, but none matched Tableau's ability to meet all our needs as effectively. Our final choice was Tableau.
Designing Innovation: Building the 'Cheil Optimizer' Solution
The 'Cheil Optimizer' solution starts by collecting marketing data from various sources. The collected data is processed and stored using the Snowflake data platform, and then dashboards are provided to campaign managers to help them analyze performance and make decisions in real-time.
However, this process was not without challenges. Cheil Worldwide faced three major obstacles and overcame them to complete the current solution.
First Obstacle: Defining the Dashboard
"Each team had different data formats, numbers, and KPIs they wanted to see."
Deciding what dashboards to create took a lot of time. Each team had different visualization requirements, and creating a single dashboard to meet all these needs was impractical. Creating multiple dashboards to meet individual team requirements also had physical limitations.
Cheil Worldwide's solution was to create 'standardized dashboards' that efficiently reflect as many requirements as possible.
They built a standardized dashboard for each type to ensure the most users could use it efficiently. The visualization elements in the standardized dashboards comprehensively reflected the requirements of multiple teams and included useful features from Tableau that were not specifically requested by the field but were beneficial.
Second Obstacle: Realistic Resistance to Data Standardization
"Field teams felt the burden of changing their existing methods."
For standardized dashboards to work effectively, consistent and high-quality data was essential. However, each team had its own way of setting up, analyzing, and inputting necessary attributes, making it difficult to create a high-quality integrated dataset.
Field teams had their own expertise and optimized styles, so the suggestion to standardize data was perceived as a burden to change their existing methods. Seung-hwan Im frankly recalled, "When we first proposed this, the field teams were not enthusiastic."
To overcome this, Cheil Worldwide focused on convincing field teams of the necessity of data standardization and building a consensus and a shared vision before starting the project.
They emphasized that "the more high-quality data available, the better the analysis" and explained that data, when managed through standardization, can provide more powerful insights and better decision-making.
Fortunately, the field teams eventually agreed, and based on this consensus, they established a common rule called 'Data Taxonomy.' As a result, they could perform deeper analyses, such as comparing and analyzing campaign performance across various departments using a unified standard.
Third Obstacle: Balancing Security and Accessibility
"Ensuring that users can only access data they are authorized to see is very important."
While using a standardized dataset, a sophisticated permission management system was needed to ensure that each user could only see data they were authorized to access. Given that Cheil Worldwide's data includes sensitive information from both internal and client sources, designing a secure authentication system was a core challenge.
To address this, they installed a Tableau server on their internal network and built a 'token-based authentication system' using Snowflake and Tableau. When a user accesses a dashboard, the backend issues a token, which is then passed through Tableau's embedding API parameters along with the target table information. Snowflake verifies the token and only allows access to the table for users with valid permissions.
The Tableau Difference
The Marketing Innovation Brought by Tableau Cloud: Faster Decision-Making and Company-Wide Data Culture
The data-driven marketing operations efficiency project has brought practical and positive changes to marketers.
- Data-Driven Rapid Decision-Making: The repetitive time spent on data collection and processing has been significantly reduced, and all employees can now check the same data in real-time through standardized dashboards. This has eliminated the need for reports and enabled faster, more consistent data-driven decision-making.
- Enhanced Company-Wide Data Capabilities: As field teams began to use dashboards, they increasingly recognized the value of data, leading to a virtuous cycle of more spontaneous attempts and ideas to use data in other tasks.
- Flexible and Efficient Collaboration: The platform supports flexible work in various environments and smooth collaboration with execution teams and development teams in India and other departments.
- Diverse Visualization: By storing ad data in image URL format and embedding these images in Tableau dashboards, they can now see in real-time which materials are performing well.
As the use of dashboards by marketers increases, new field requirements continue to emerge. With Tableau's recent introduction of many AI-related features, our goal is to better utilize these features to create even more advanced dashboards.
The Technical Innovation Brought by Tableau: A Flexible and Efficient Development Environment
Yujin Shin, a professional from the Digital Tech Department, evaluated Tableau's strengths from a developer's perspective.
- Real-Time Data Reflection: Tableau can connect to various databases, including Snowflake, in real-time and reflect chart data with almost no delay.
- Flexible Permission Separation: Tableau makes it easy to assign permissions and, when combined with its security features and initial SQL (Initial SQL) based dynamic control at the database level, developers can implement permission separation at the SQL level without significant involvement.
- Reusable Structure: Common settings, such as calculated fields and parameters, can be created once and reused across multiple sheets and dashboards. This structure allows for quick expansion of new dashboards based on templates and significantly improves work efficiency.
Rapid Requirement Adoption: New filters or items can be quickly applied at the visualization layer without modifying the original table, making it easy to reflect new requirements promptly.
From a developer's standpoint, Tableau is an attractive tool that maximizes operational efficiency. It allows for the rapid and stable implementation of complex requirements with minimal developer intervention.
The Actual Dashboard Solutions Implemented
The dashboards built by Cheil Worldwide are categorized into two main types:
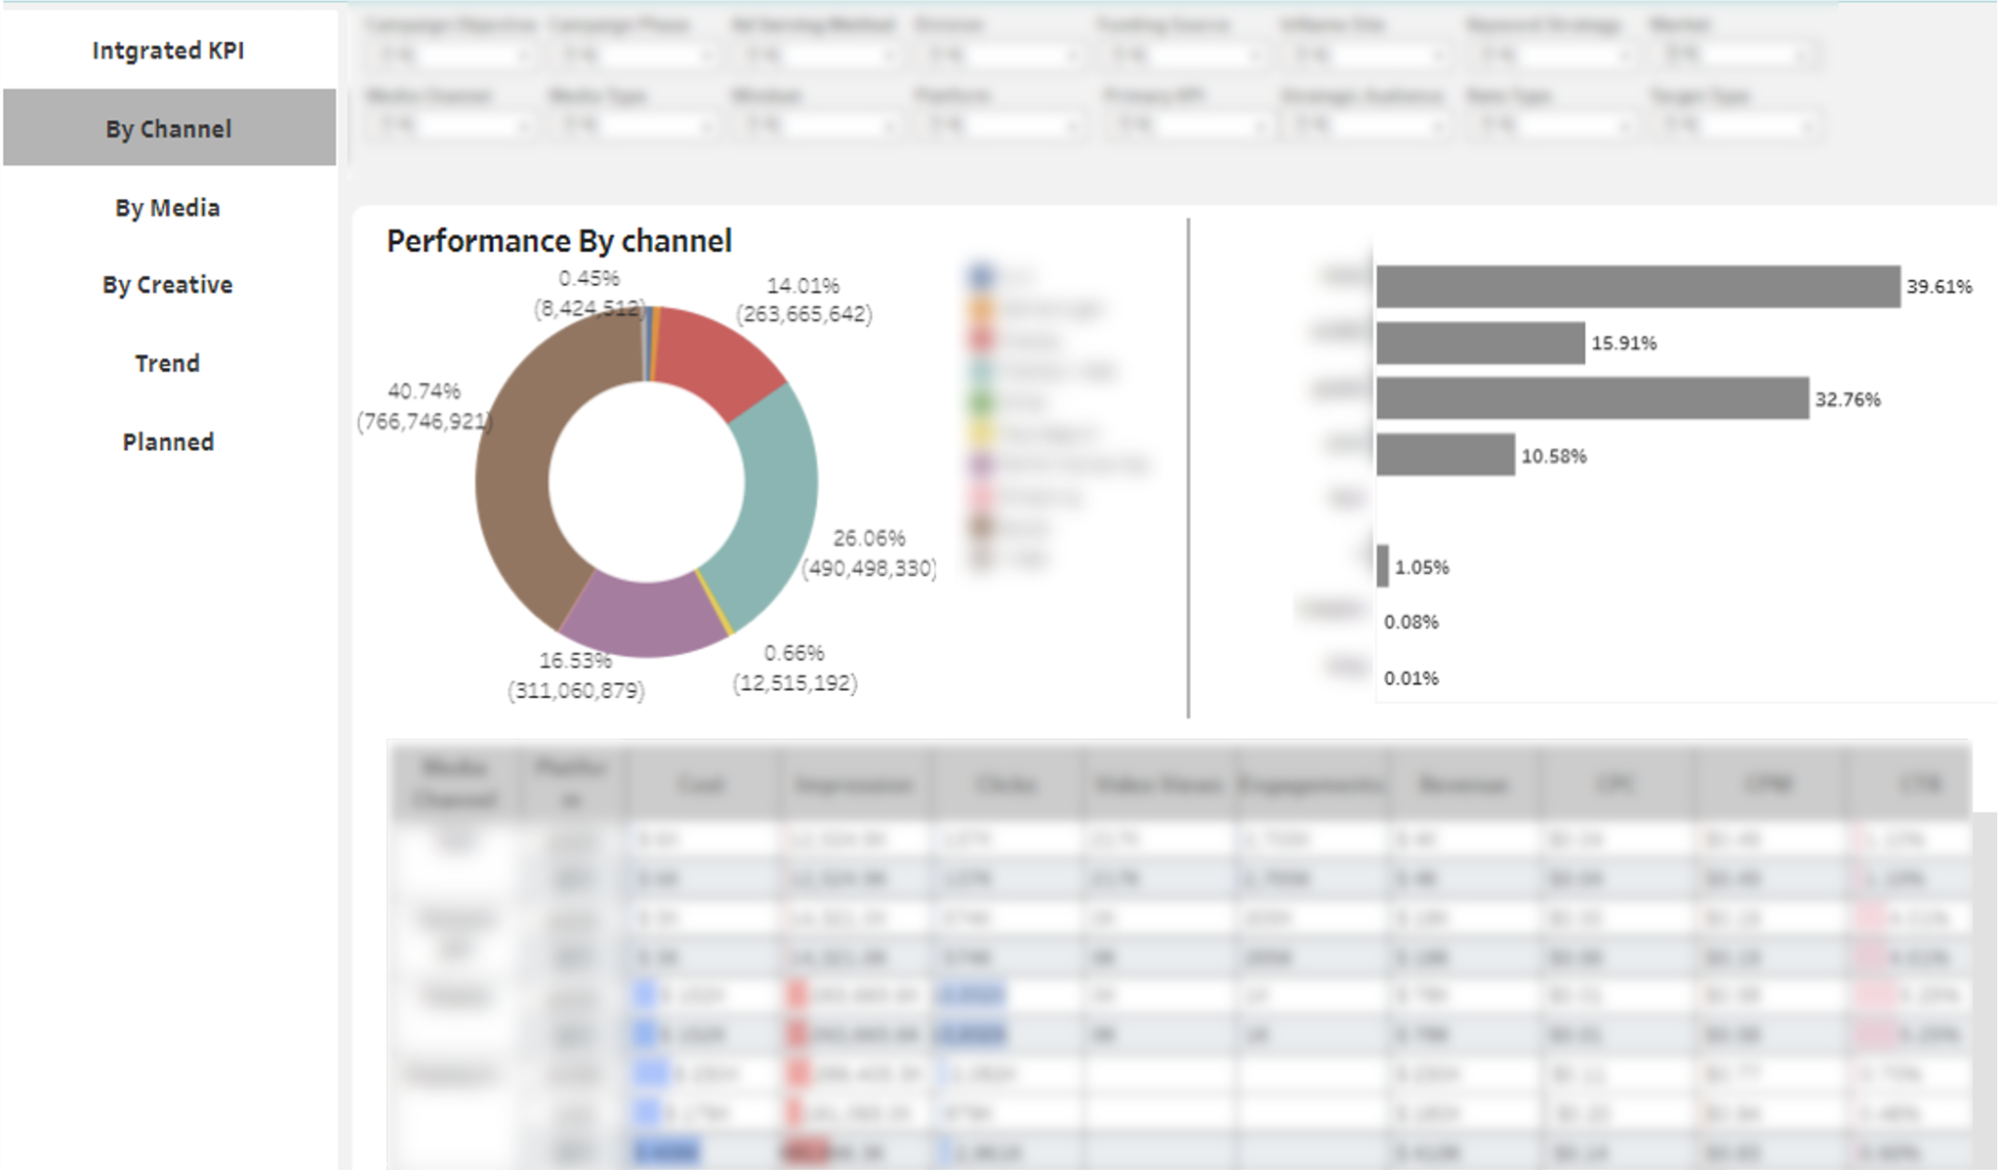
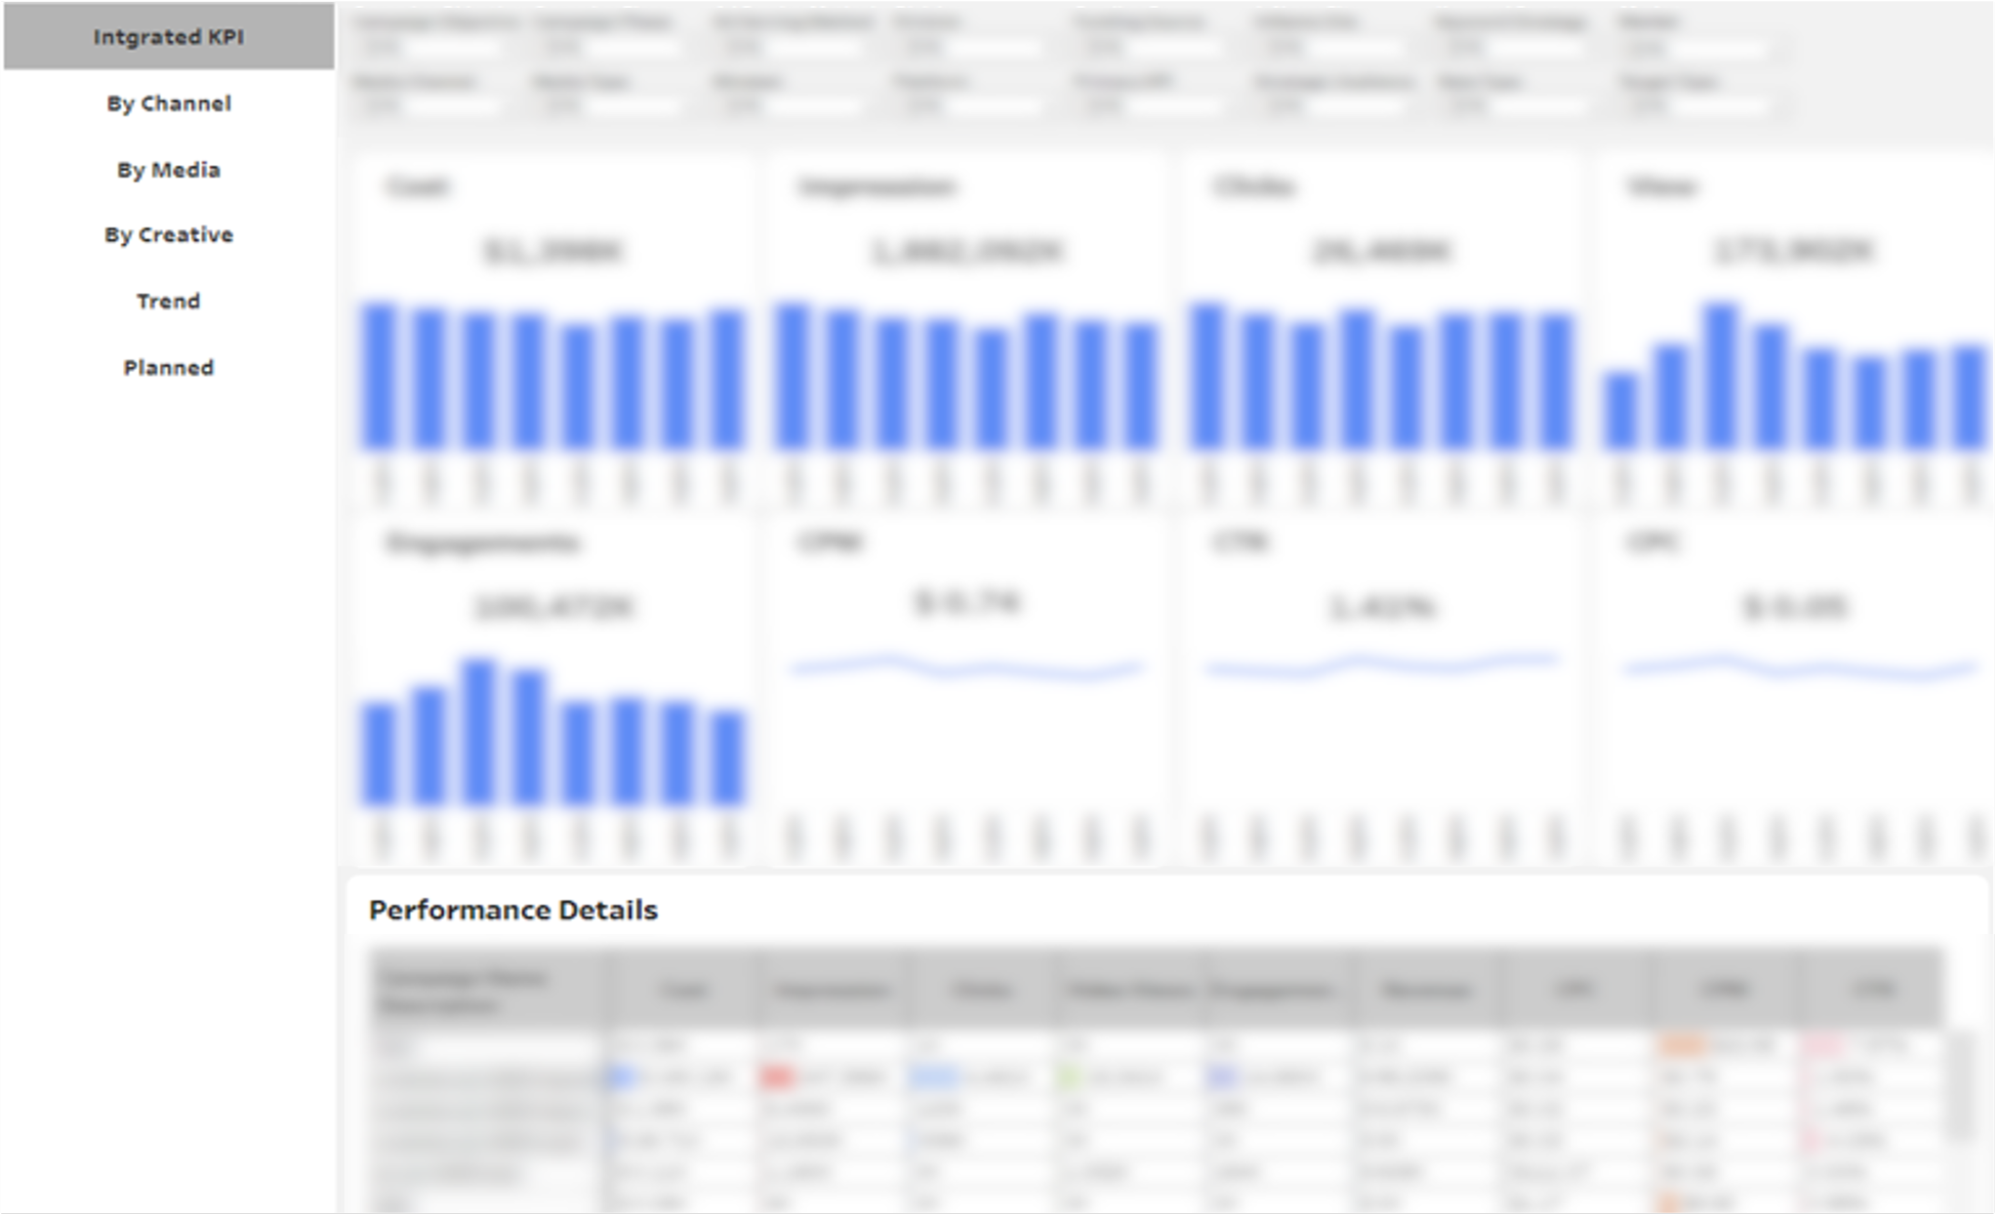
Digital Media Campaign Dashboard: It is crucial to understand in real-time which metrics, channels, attributes, and targets are most effective and their trends. The dashboard is designed to provide a comprehensive overview of key metrics such as spending per channel, channel efficiency, impressions, clicks, costs, and CPC.
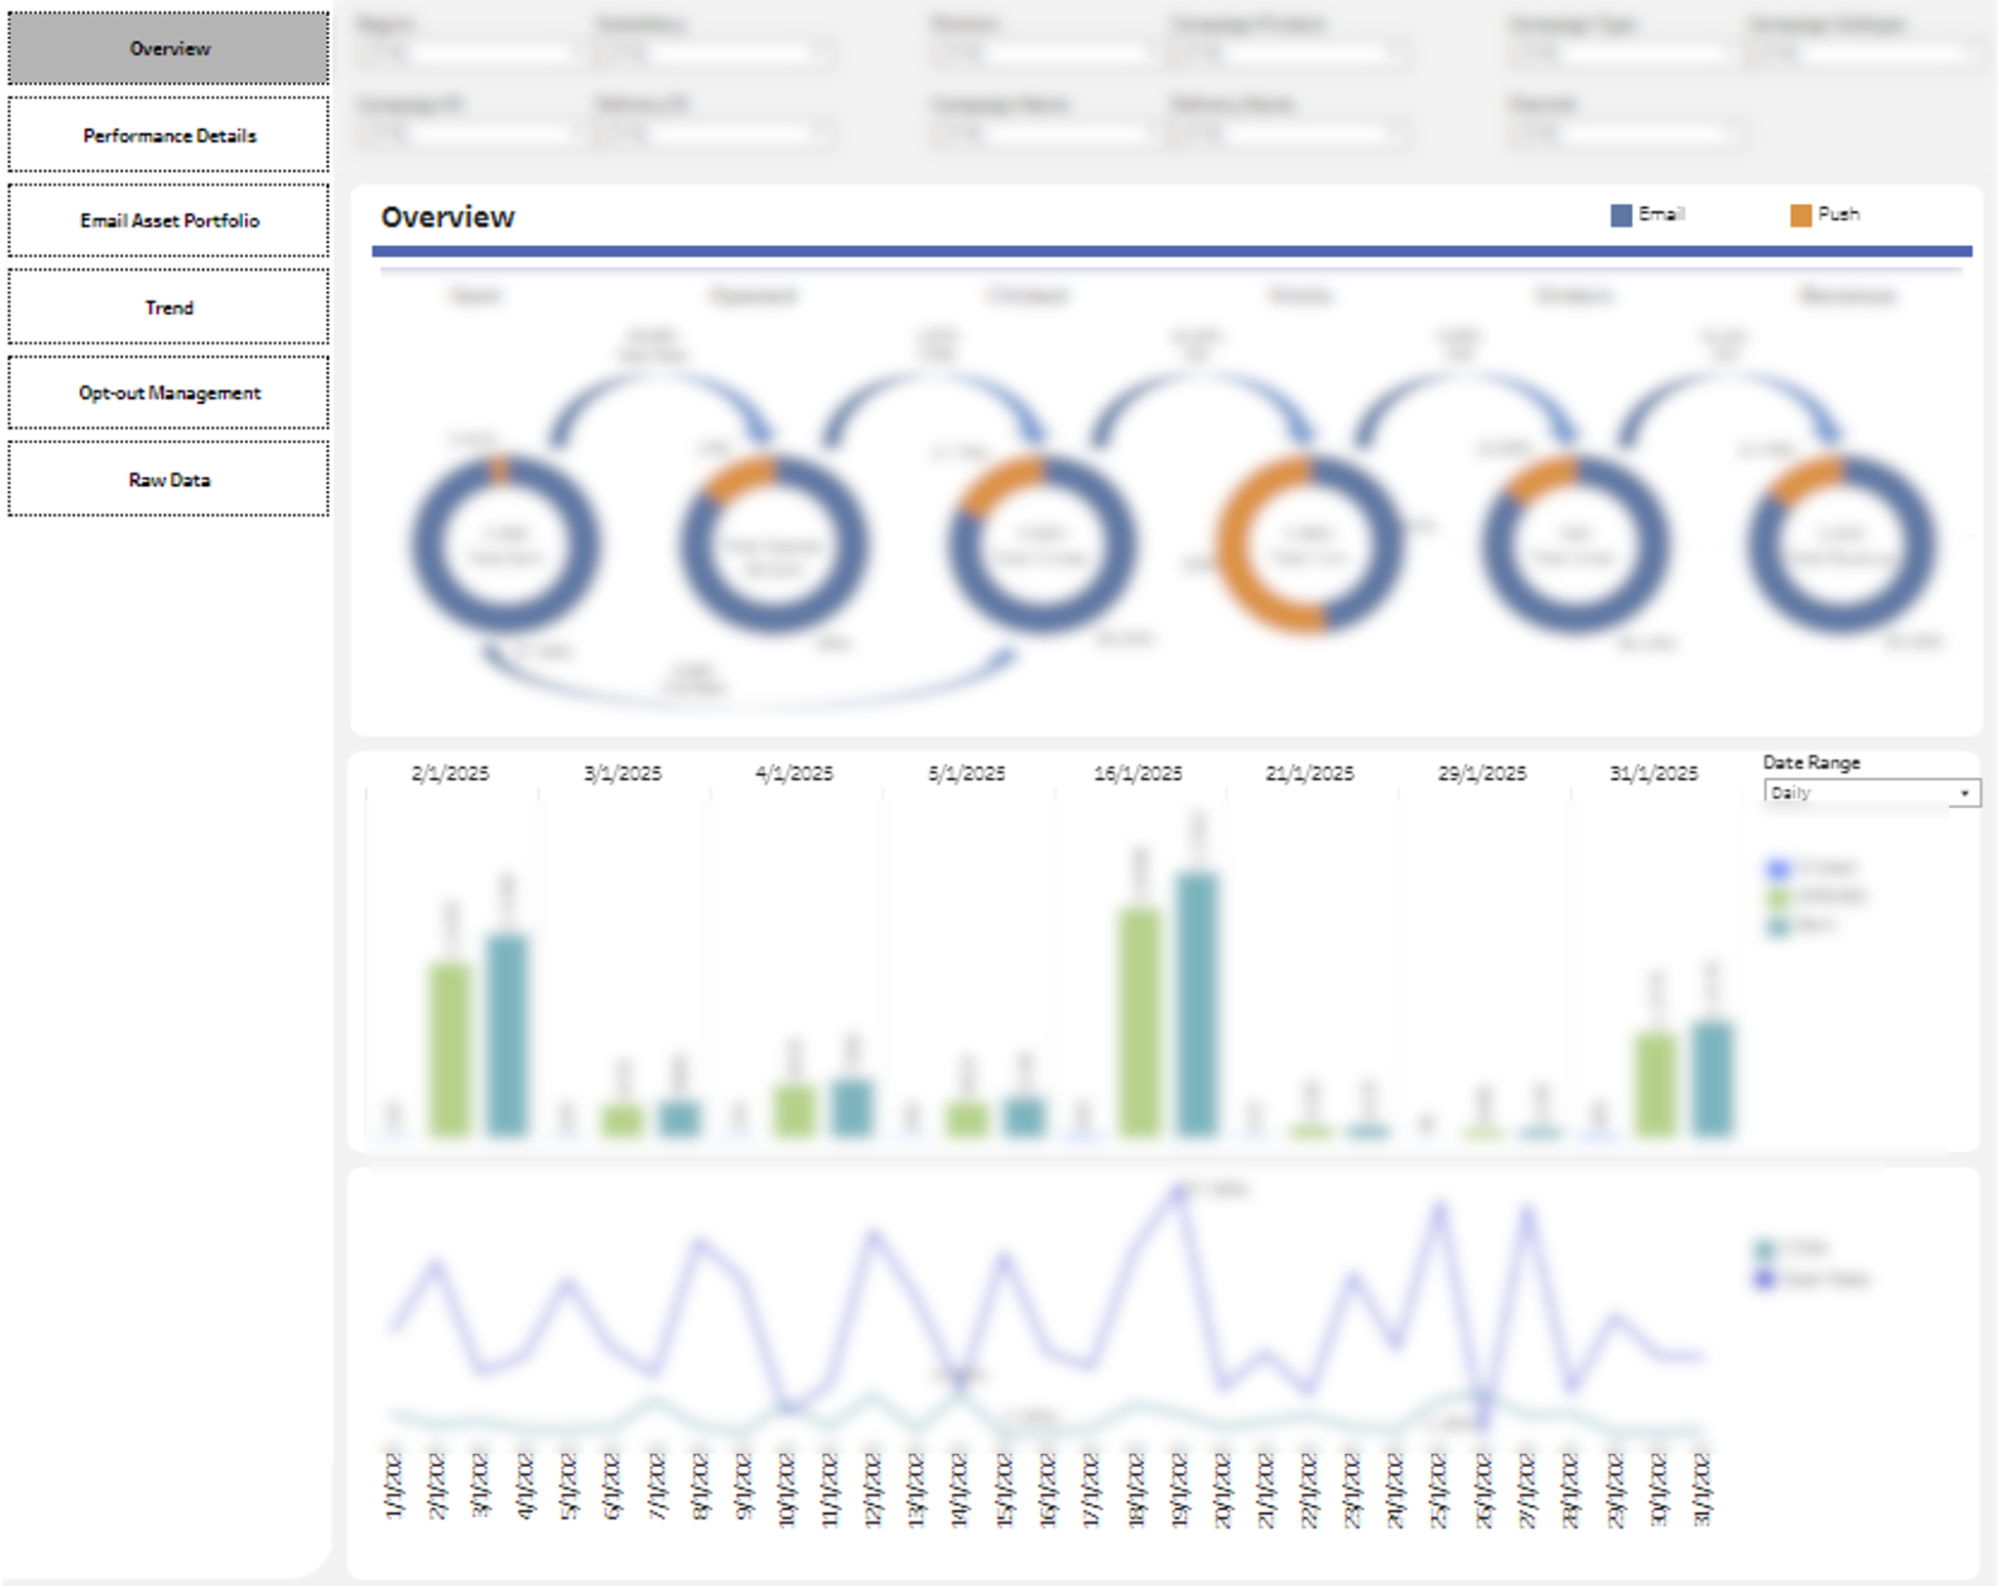
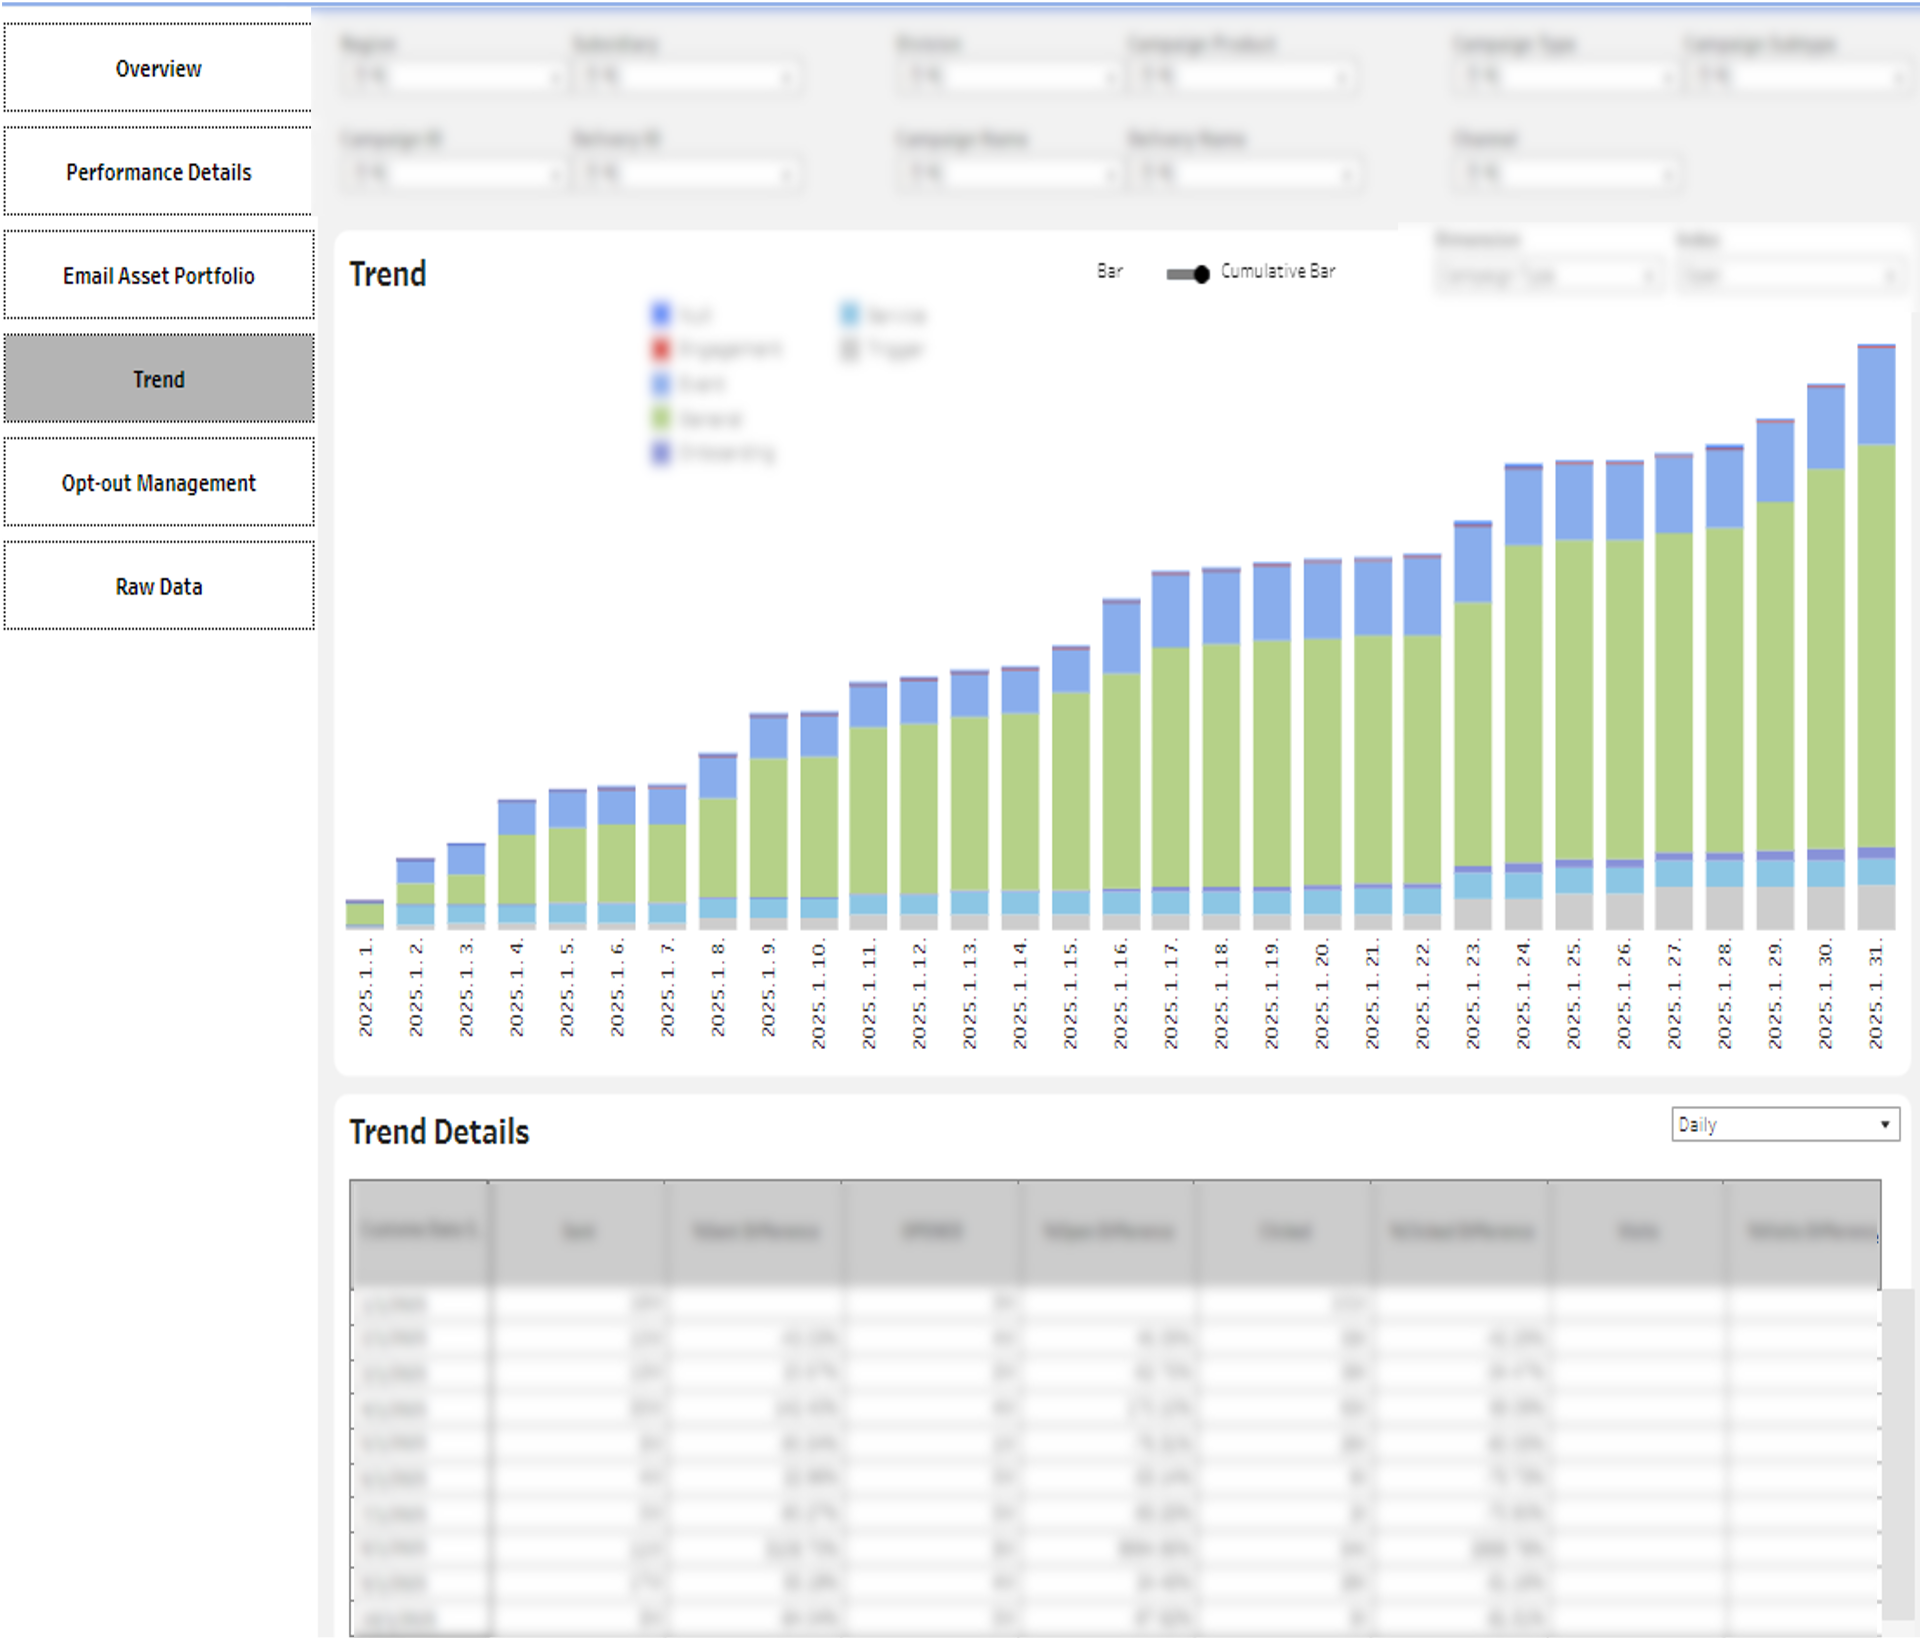
CRM Campaign Dashboard: This dashboard typically shows the performance of campaigns using email or push messages. Similar to the digital media campaign dashboard, it reflects various requirements to provide a clear overview of key metrics and performance trends.
New Challenges for the AI Era
Currently, Cheil Worldwide is setting the next goal to build next-generation dashboards using Tableau's advanced features and enhance company-wide data capabilities. They are actively responding to the evolving Tableau features and new field requirements to create a more advanced marketing operations system.
As the use of dashboards by marketers increases, new field requirements continue to emerge. With Tableau's recent introduction of many AI-related features, our goal is to better utilize these features to create even more advanced dashboards.
A New Paradigm in Marketing Operations
The partnership between Cheil Worldwide and Tableau is setting a new paradigm by integrating data and creativity in marketing operations. Their innovative case is becoming a leading model for spreading a data-driven decision-making culture across the advertising industry.