Sports Roundup: How Teams, Players, & Fans Are Using Data


March Madness marks the end to what our sports analyst Dash Davidson calls the “sports purgatory that is the weeks following the Super Bowl."
To bridge the gap, Davidson curated a series of sports-related vizzes over on Tableau Public, where the entire month of March was dedicated to sports. Here are a few highlights.
Testing the Myth of the Tommy John Surgery
Does Tommy John surgery help pitchers throw faster? Some believe performing the reconstructive surgery on a healthy elbow could add speed to the pitcher’s fastballs. Uninjured pitchers have even sought out the procedure despite doctors’ cautions.
To test this myth, Matt Cobb and Matthew Chambers (a.k.a. "Sir Viz-a-Lot") looked to the data. They found a list of pitchers who’d had the surgery, then assessed each player’s performance before and after the procedure.
“We decided that walks plus hits per inning pitched (WHIP) was the most fair statistic since a pitcher only controls how many walks and hits they give up per inning,” Chambers says. “Earned run average is not always a fair statistic because it depends heavily on the defense behind the pitcher as well as the size of the pitcher’s home stadium.”
Here's what they found:

The data showed that “WHIP and ERA are higher after the surgery, thus illustrating that there is no advantage from a statistical perspective from having the surgery,” Chambers says. Myth busted.
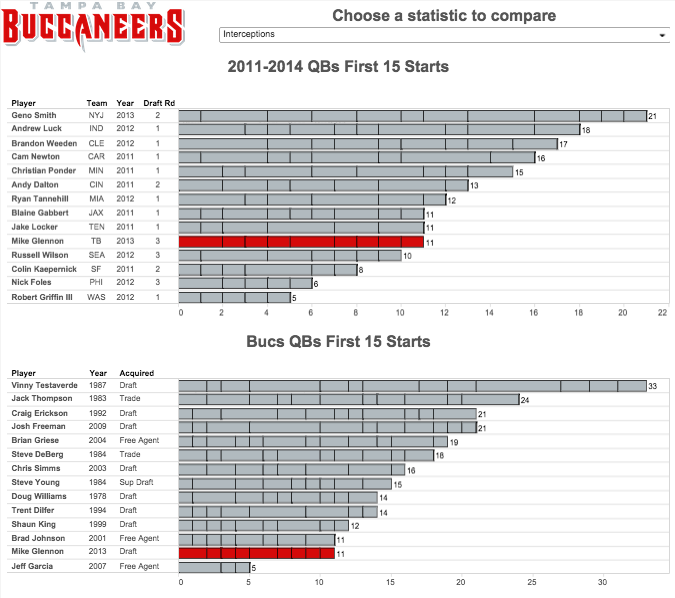
Measuring Up the Buccaneers
The Tampa Bay Buccaneers used a similar approach to show how their players stack up. Through a series titled Data Crunch, the team gave its fans a chance to explore its star players’ statistics.
In one viz highlighting Mike Glennon, for example, fans could see how the second-year quarterback measures up against his draft contemporaries as well as former Buccaneer legends.

The team made a similar viz for wide receiver Mike Evans, which picked up steam as Evans entered the running for Rookie of the Year.
“We found that fans enjoyed checking on Evans’s candidacy for the award and [we] decided to update the stats throughout the season,” says Eric Holland, the team’s coordinator of analytics.
Alas, Evans didn't win, but the Buccaneers aren't done. The team has other data-driven stories in the works, including vizzes for the upcoming NFL draft.
The Quantified Self on Skis
Here's a first-person example from Merlijn Buit, who'd just gone skiing for the first time in his life.
“The first days were more about survival than about skiing,” Buit says. “That’s why I decided to also record my ski (read: survival) activities, so my colleagues could track me when my skis would bring me far away from civilization.”
Jokes aside, Buit was curious about the data. So he brought along his Bryton GPS meter, which he uses to track his bicycle rides. Buit visualized the data to see where he gained the most speed, where he crashed, and how he progressed over the five days on the slopes.
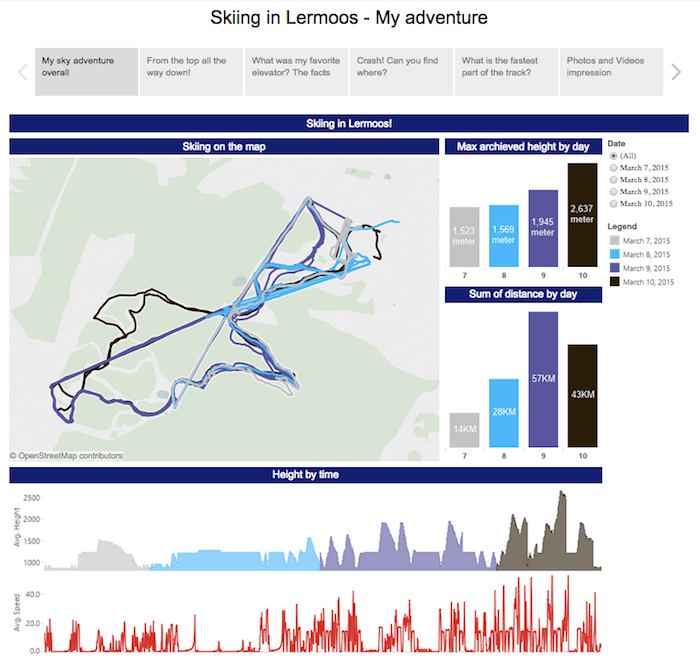

“In my dashboard you can immediately see that I’m getting more control over my skis,” says Buit. “I even rocked a red [intermediate] slope (actually, I forgot to turn right and there was no way back to return to the blue [beginner] slope).”
Those are just a few of the stories from Sports Month. You can check out the full series on Tableau Public.
More from The Tableau Community
Other sports teams are finding different ways to put data to work. The Seattle Sounders are using wearable devices to track heart rates, conditioning statistics, and even sleep quality. The coaches then visualize the data to make decisions about team practice schedules and individual training regimens.
The Texas Rangers’ front office is using data to see what gets their fans excited. The team reviewed five years of attendance and discovered the so-called “bobblehead effect": Tuesdays, when the team routinely scheduled promotions and giveaways, were the only days to show a rise in attendance.
"You know, it's not a Friday or a Saturday; it's not the weekend," says Sarah Stone, the team's advertising and marketing manager. "We said, 'Oh, my gosh, like, these things are really moving this day of the week that people didn't normally buy."'
To put their theory to the test, the team scheduled another bobblehead giveaway on a different night to see if there's a correlation. And the team was delighted to see an increase in attendance for that game as well. Hear Stone tell the whole story:
Got a data story of your own? We'd love to hear it. Send us your thoughts to ideas@tableau.com.
เรื่องราวที่เกี่ยวข้อง

DataFam Roundup June 2026

DataFam Roundup May 2026

Iron Viz 2026: Read Between the Data
 May 28, 2026