Kaiser Family Foundation: How understanding health system data can inform our response to COVID-19
We spoke with Rabah Kamal, a senior policy analyst at KFF who leads work on the Health System Tracker. In this blog, Rabah discusses what data they’re analyzing to understand COVID-19, the complexities and limits of that data, and how data can foster collaboration on solutions as the pandemic progresses.


Editor’s Note: Rabah Kamal recently joined us as an advisor to the Tableau Coronavirus Data Resource Hub. She is a senior policy analyst whose work on the Peterson-Kaiser Health System Tracker includes developing graphics to communicate health system trends, synthesizing research on health system costs and performance, and collecting and analyzing data. She also conducts policy research on pricing and insurer participation in the ACA’s exchange markets.
During the COVID-19 pandemic, the spotlight has turned on data and health in an unprecedented way. Every day, people are scanning reports for data on case counts, hospital capacity, and mortality rates. And they’re beginning to understand that the effects of COVID-19 are not just the result of the virus itself—they factor in longstanding trends in health systems, from overall individual wellbeing to the affordability and access to care, to the quality of that care that people receive.
To understand the effect of a pandemic like COVID-19 on a health system, you first have to understand the system itself. The Kaiser Family Foundation, a nonprofit focused on national health issues in the U.S., has been further that understanding for years. Through its own data and policy analysis, and through the Health System Tracker managed in partnership with the Peterson Center on Health, KFF aims to provide reliable information on the health care system in the U.S. and on the factors affecting it.
As COVID-19 has emerged as one of the most significant of these factors, KFF has responded with policy and data analysis. As a partner organization on Tableau’s COVID-19 Data Hub initiative, KFF brings longstanding knowledge of trends in health system data, and perspective on how to apply that data to our understanding of COVID-19.
To bring some of that analysis and insight to the Tableau community, we spoke with Rabah Kamal, a senior policy analyst at KFF who leads work on the Health System Tracker. We discussed what data they’re analyzing to understand COVID-19, the complexities and limits of that data, and how data can foster collaboration on solutions as the pandemic progresses.
STEVE: The Health System Tracker is such a critical tool, and it has so many eyes on it during this pandemic. What was the goal when you first launched it, and how is COVID-19 proving it out?
RABAH: The Health System Tracker launched in 2014 as a collaboration between KFF and the Peterson Center on Healthcare. We wanted to create a data hub that would speak to the question of how the US health system is performing at a high level. That's a big question, and there’s a whole patchwork of data to consider when we try to answer it. On the HST, we break it down into four main categories: health spending, quality of care, access and affordability, and health and wellbeing.
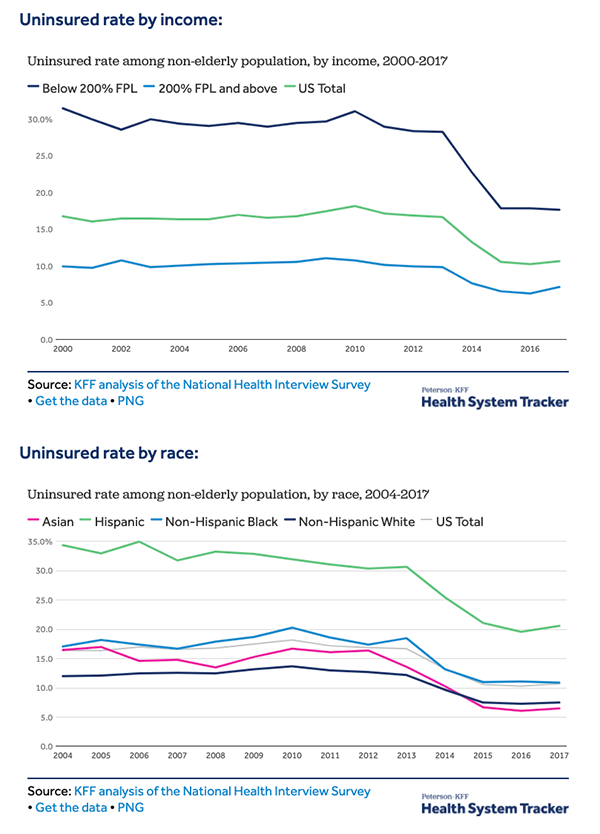
One component of the HST is looking at certain trends over time in the US. We’re able to see things like how health spending has changed over time, changes in per capita spending, changes in the quality of care over time, how affordable care is for people, and how people are accessing care. These are all really important baselines to understand. They go beyond indicators like mortality and life expectancy, which we hear about a lot but can be hard to contextualize.
"These data points really show the care infrastructure and how people are using it, which we need to understand as it’s being strained due to the pandemic."
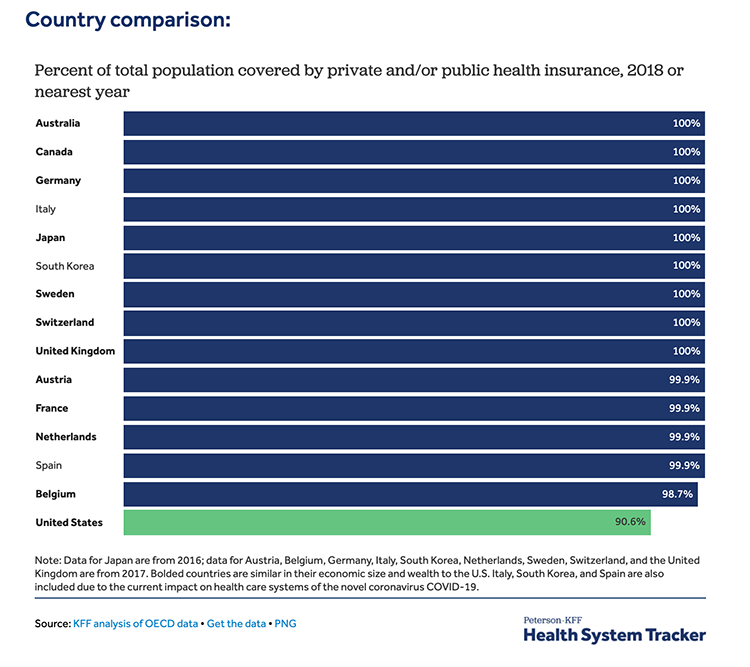
The other part is comparing the US health system, in all the ways that we can, to countries that are similarly wealthy, particularly when it comes to health spending as a portion of GDP. We’ve been building this really rich resource over the years, and the indicators in it underlie a lot of the discussions happening around health care issues and health policy—not just during the pandemic, but on a broad scale.
STEVE: Like you said, there’s an enormous patchwork of data to draw on to understand the health care landscape. What data goes into the HST? Can you describe the complexity of working with all of this health care system data?
RABAH: We used a whole lot of different data sources to build the HST. But we do a lot of vetting and thinking on what indicators we choose to put on the Tracker, and what’s actually comparable.
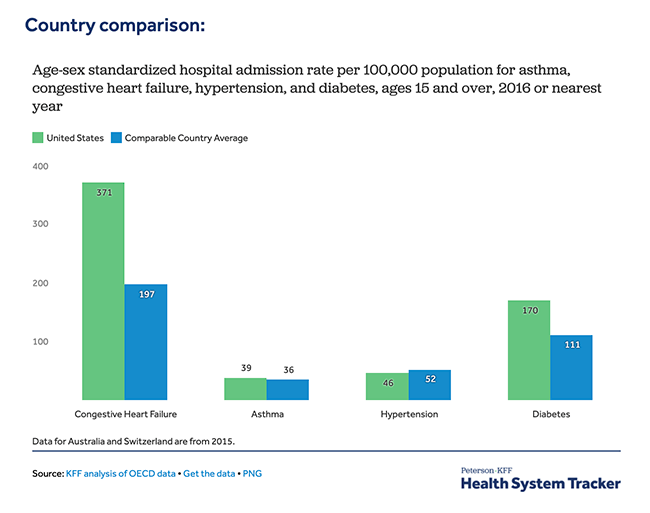
As an example, we have a whole section on quality of care. But measuring quality of care is still an evolving process. There's no set way of doing it. On our dashboard, the quality-of-care measures that we ended up using are things like preventable hospital admissions, hospital-acquired conditions, and re-admissions. But these aren't necessarily easy indicators to pinpoint because there are different approaches to determining, for example, what exactly is a preventable hospital admission, or which hospital-acquired conditions to include. We have some guidance: The ACA has begun to track some as part of the effort to shift to more value-based payments, and there’s the National Academy of Medicine’s Vital Signs report, that tracks 15 core measures around health in the U.S. But it’s well-known in the field of health care quality that there is an overabundance of measures, to the point where it’s difficult to track and compare metrics. We’re constantly in discussion with other experts in the field around specific measures, and around which data sources are the most robust and dependable.
The other difficulty is that there’s not a whole lot of comparable data across countries. But there are organizations that have put together amazing databases by working with countries to collect these data, and to make them available and comparable. One of the main ones that we use from the OECD, which includes metrics from the 37 member countries who have committed to participating in the data-collection process. And we also pull in data from the Institute for Health Metrics and Evaluation at University of Washington. That’s been particularly useful because they look at disease burden—so it’s not just looking at mortality rates, but it’s looking at the actual experience of people’s lives and how it differs from one place to another. We do a lot of synthesis out of these data sources, and both our team and KFF more broadly apply our own analyses to the data.
STEVE: In the midst of this pandemic, the spotlight is on health system data. What are we able to understand about the health system and COVID-19’s effect on it now, with the data that we have?
RABAH: This is all still evolving, and there’s still a lot of gray area. What we’ve been focusing on with the Tracker are a few different elements that broadly speak to the preparedness of the health care system. We’re able to see how much is being spent, the quality of care, and access, and all of that feeds into how a health system can respond when there's a sudden emergency at a sudden moment in time, when a lot of people need to go directly to the hospital and get care.
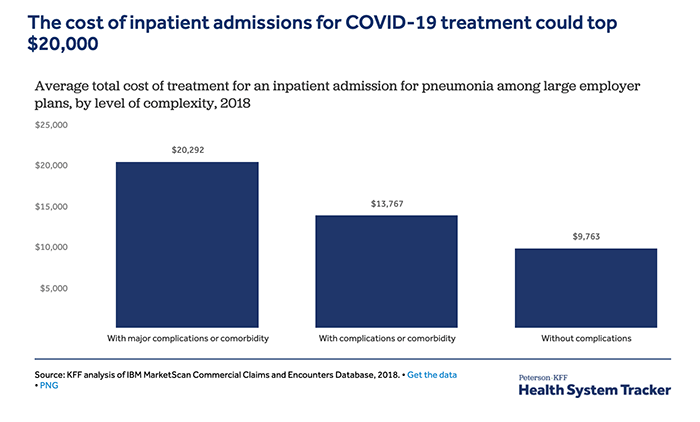
One of the things that we were able to analyze early on was what the potential cost of COVID-19 treatment would be for people who have coverage through their employer. That’s based on claims data for the large employers in the U.S. that we have access to—it’s a really rich data set. Obviously, we don’t know exactly what COVID-19 treatment will include, but we were able to estimate based on the cost of admission for pneumonia, with the assumption that it would be similar. While they’re averages, it’s a really powerful thing to be able to get these estimates using this kind of data.
But we also have access to data from the National Health Interview Survey, the Medical Expenditure Panel Survey, and others. This data can speak a lot to what people’s experiences are when it comes to affordability issues. In the employer claims data we can see information on people’s cost-sharing, deductibles, and co-pays. And then in the national surveys we can see when people say, for example, that they’re delaying or forgoing care because of costs. We can then do a side-by-side analysis to get a sense of what types of services people are forgoing in this environment because they’re worried about not being able to afford care. We need to be able to pull in a lot of data on different indicators to see the complexity of the situation.
STEVE: COVID-19 is so complex because it’s a health issue, but it’s also an economic and political one. How can the data in the HST contribute to larger policy discussions as this situation evolves?
RABAH: The Tracker offers a piece of a bigger conversation. What’s evident is that it’s not just about a health system’s preparedness or what it has in place—it’s also about the policy decisions that can have a big impact on the differences we’re seeing in how health systems are affected. KFF has created resources that go hand-in-hand with this idea. For example, we have a state action and policy tracker that looks at not just case data by state, but also at when states took (or didn’t take) different actions like social distancing, and my colleagues have been tracking that over time. We need to understand those policy decisions in conjunction with our data on the healthcare system.
Watch our interview with Jennifer Tolbert on If Data Could Talk.
But there is so much data we need to be looking at now, and there are so many unknowns. This is a time when, I think, expertise with different kinds of data is really important to turn to. We need to understand all of the nuances in these different areas of expertise, and in the data that people in those fields are analyzing. It’s important to keep collecting data and tracking it over time, and it’s important that we recognize that there are people who spend their whole lives around certain data and understand the trends and the contexts and the nuances. We’re in this moment now where people who have these different areas of expertise are being called on to put their heads together and combine their understanding and say: Ok, what do we think is likely to happen? And then continue to analyze and fill in some of the gray area with data.
เรื่องราวที่เกี่ยวข้อง
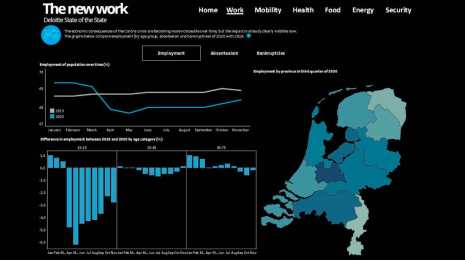
What we can learn from open data: COVID-19 in the Netherlands
 เมษายน 29, 2021

After a year of COVID-19 charts, eight data communication lessons learned
 เมษายน 19, 2021
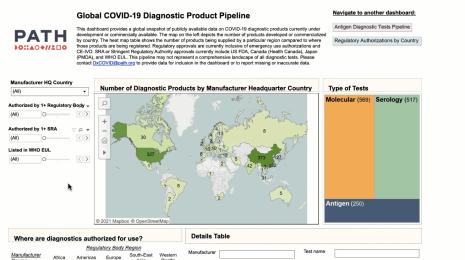
Data innovations in public health: PATH creates COVID-19 diagnostic test dashboard
เมษายน 2, 2021