All the Things: Data Visualization in a World of Connected Devices


The Internet of Things is a powerful ecosystem. Devices or “things”—which encompass everything from pedometers to seismographs—are producing unprecedented amounts of data about the world around us. When put in the hands of everyday people, this information can make every area of life more data-driven.
"Things" aren't really a new concept. After all, we've been using sensors to collect scientific data for centuries. What's different now is the interconnectedness of all these devices—plus the fact that they're producing ever more granular data sets... all while that data is getting more and more accessible to everybody.
But once we have all this data, what do we do with it?
To actually put that data to work, you need to make sense of it. Take this visualization by data blogger KK Molugu. It received an honorable mention in the Divvy Data Challenge—a visualization contest held by Chicago's Divvy Bikes, which released 759,000 rows of location-based data last February.
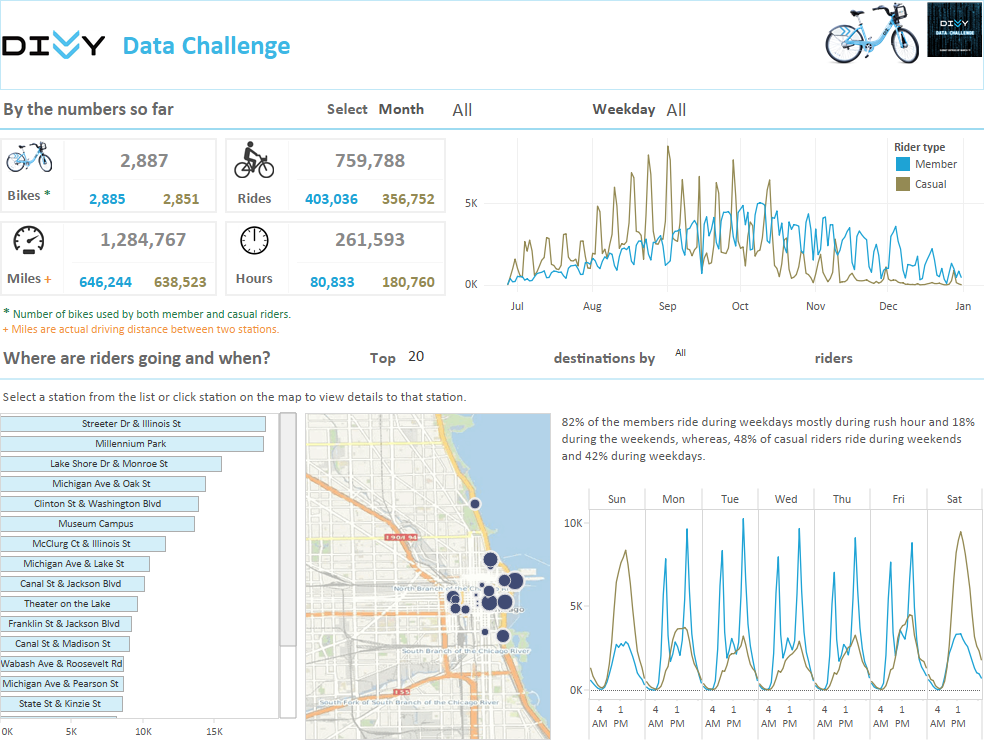
This viz makes it clear that weekend rides are dominated by non-Divvy members. Maybe Divvy’s core user base is renting bikes for shorter, more everyday tasks—while casual riders just borrow a bike for a day or two.
Trends like this are hard to outright spot in a large set of data. Take wearables. These "things" are giving people access to very minute information about their bodies. But that data isn't really helpful unless it's turned into a story. This viz by Martijn Verstrepen shows how that's done. Martijn recorded his location, heart rate, even a video clip at each moment during a bike ride—then linked them all together into a cohesive visual story.
When massive amounts of data become accessible and understandable, the implications are enormous for both civic life and personal health. But how does this apply to business? Well, let's take a look.
The Internet of Things is changing the game for data access. And when real people can actually visualize and interact with this data—even blend it with their organization’s other data assets—entirely new insights can be reached. From jet engines bolted on airliners to pacemakers embedded in hearts, the increasingly interconnectedness of devices around us mean we can see our world in completely new ways. Ultimately, this empowers innovation that's not only data-driven but deeply human-centric.
Thumbnail photo credit: Martijn Verstrepen, Verstrepen Analytics, via Talk Data to Me.