Accelerating climate action with data: Tableau Foundation looks back at 2019


Editor’s Note: As the year comes to a close, the Tableau Foundation team took the opportunity to reflect back on what we’ve learned about poverty, inequity, climate change, global health, and employee engagement. This series of blog posts shares the most critical insights we’ve gained from our partners and our programming over the past year, and we look forward to what’s to come in the next decade.
Even on the most optimistic of days, thinking about climate change can be overwhelming. And because of that, it can be tough to feel like there are ways we can take action against it. But a clear picture of the data around climate change—and the people who stand to be affected by it—can make a path forward more visible.
Tableau Foundation partners with organizations using data to further our understanding of the climate crisis on a broad scale, but also bring it down to the local level. Giving people the tools and data they need to connect the climate crisis to their own lives and their own backyards make combatting it both more tangible and more possible. Over the past year, we’ve deepened our existing partnerships for climate action and begun working with several more organizations to further our impact. Here are some of the key insights that we’ve learned through these partnerships.

1. Good climate data exists, but we need ways to make it accessible
For the Tableau Foundation, climate action has always posed a unique challenge. “Even though the climate sector has a ton of data, it’s been challenging to simplify it for those who can use it to help make decisions,” says Neal Myrick, global head of the Tableau Foundation. A lot of the data is housed in complex academic reports, and not very intuitive for people trying to understand the crisis or take action against it. “There’s a huge divide between the information haves and have-nots here,” adds Jason Schumacher, head of U.S. grantmaking at Tableau Foundation.
This past year, Tableau Foundation partnered with Grist, a non-profit climate journalism publication, to bring some of this data to a broader audience. We’ll be supporting a team at Grist to use Tableau to visualize climate data and integrate it into their reporting. Adding a layer of data visualization to their storytelling, says Clayton Aldern, a data journalist at Grist, will enable them to translate the complexity of climate data into the wider framework of a story. “I don’t think we as readers, and we as journalists need to shy away from complexity, and I think that’s particularly true in the face of something like climate change,” Aldern says. “These are incredibly large, incredibly fuzzy data sets, and that’s just the world in which we need to operate—we can’t shy away from this data because it’s hard.” What the value of data journalism in the climate space, Aldern says, “is adding another tool to the toolbox that we use when trying to tell these complex stories.”

2. Localized climate data is a powerful tool for action
As Grist’s climate data journalism ramps up, one of the things Aldern has told us he’s most excited about is developing ways to make the general more specific. “How do you drag this data not only from the future into the present, but also bring this nebulous, intergenerational, cross-border monolith into the realm of the personal?” he says.
One of our other partner organizations, Headwaters Economics, has been working in this framework for a while. As a non-profit research organization, Headwaters works particularly at the intersection of people, the environment, and the economy, says Patty Hernandez Gude, associate director at Headwaters. And what that often means is that their research integrates complex data on climate change and the environment with information about specific contexts.
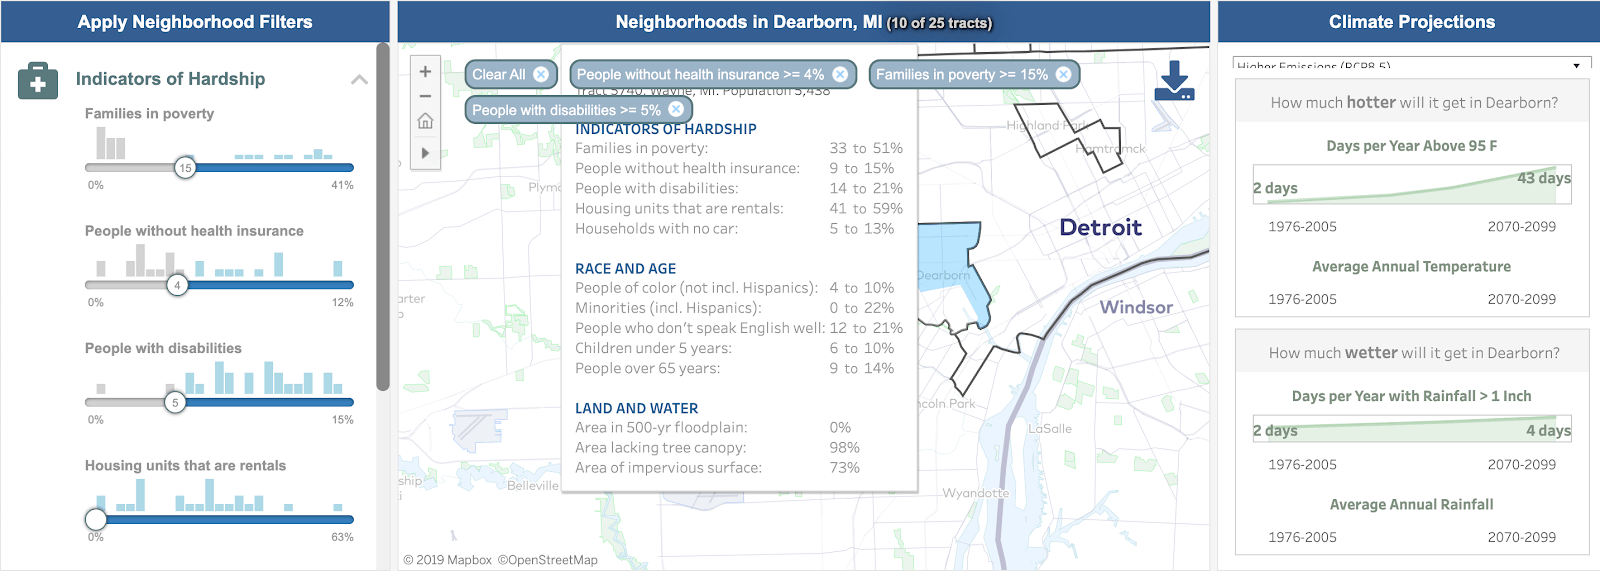
One tool that Headwaters developed recently, Neighborhoods at Risk, shows a handful of different cities’ vulnerability to climate change down to the Census tract. Now that Neighborhoods at Risk has existed for around a year, Headwaters has begun to learn from the communities who have access to it how valuable it is. Cities like Dearborn, Michigan, and Denver, Colorado are using the data visualizations available through Neighborhoods at Risk to re-prioritize investments in essential infrastructure like transit or tree cover, based on where the tool has shown them it’s needed.
For Gude, the success of the Neighborhoods at Risk tool has demonstrated how climate data—when brought directly into conversations with communities—can be a tool for action. “There’s a lot of philanthropy and a lot of work going on right now around disaster response, but less energy—although there’s a huge role for it—around applying demographic and economic data upfront so that communities are better prepared,” she says. Headwaters will be building out new programs to help communities work with data to better prepare for events like wildfires and floods. “We want to bring resources to communities so that they can understand what their level of risk is, and then how their land-use policies fit together—everything from their master plan to building codes to zoning ordinances. And how they can be structured correctly to make them much more resilient to climate change.” Just as Grist aims to show how bringing data visualizations to their readers can strengthen their understanding of the climate crisis, Headwaters is teaching us how equipping communities with actionable, local data can protect them in the long term.
3. Equity needs to be at the center of climate action
As we’ve worked with our partners in the climate action space; what we’ve learned is that it’s impossible to talk about climate change without talking about equity. Well, it’s not technically impossible—but it’s shortsighted to try to separate them. “Demographic and economic data needs to be easy to understand and accessible as we think about climate adaptation,” Gude says. “Historically, marginalized and underserved areas are the places that really struggle when there’s a climate-related natural disaster.hey often just do not have the financial resources and, at least historically, haven’t had the attention and mitigation resources directed their way by cities and governments.” Data showing the link between climate change and socioeconomic and racial inequity can help communities transform how they support historically marginalized populations.
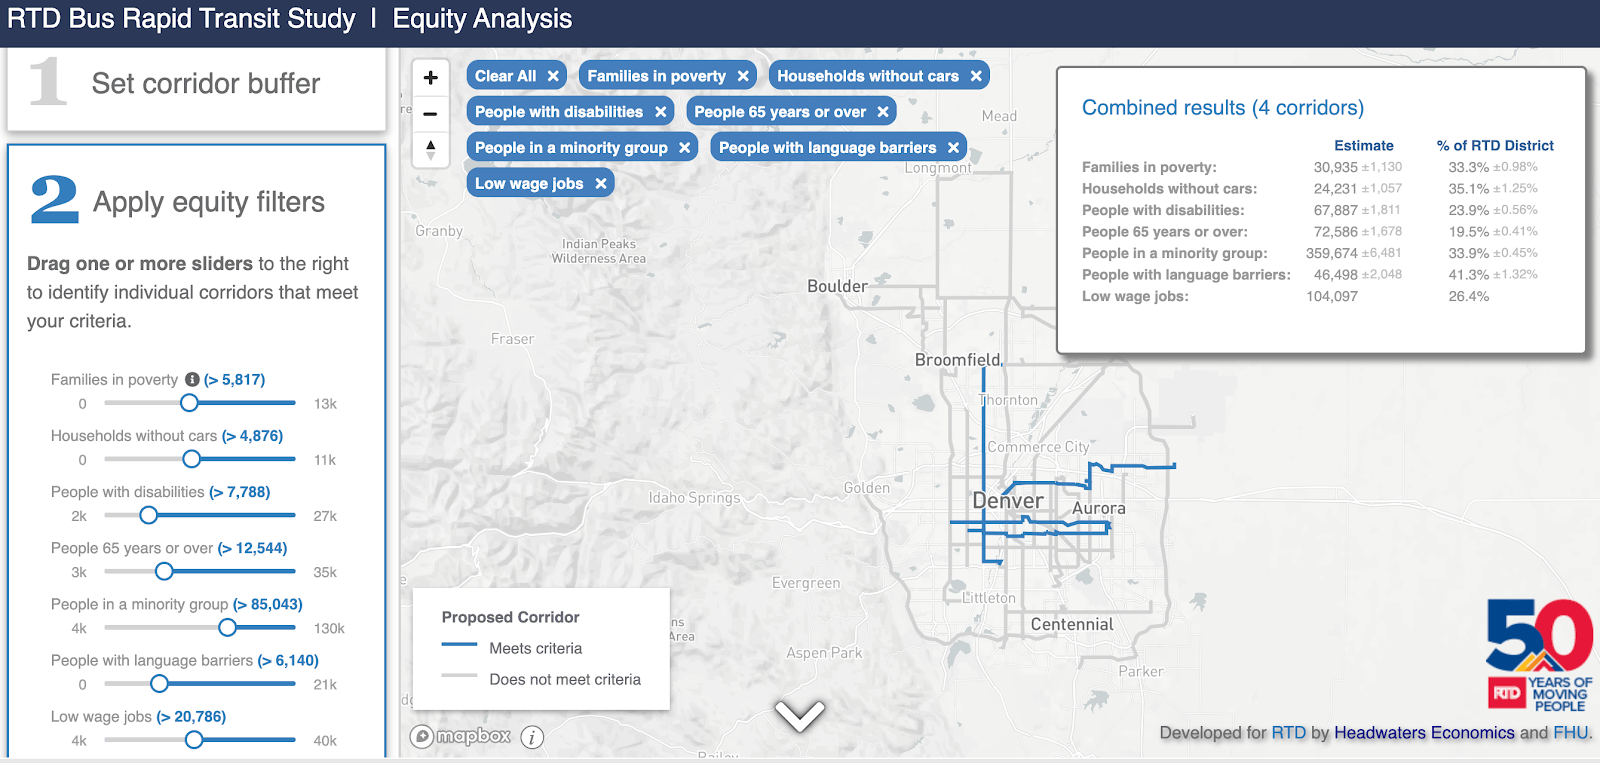
We’ve seen, from Headwaters, an example of how that can happen this year. After Denver analyzed its climate vulnerability data through Neighborhoods at Risk and saw how disproportionately lower-income neighborhoods would be affected, it decided to do something about it. With the support of Headwaters, they built a tool to help the city prioritize the development of new bus rapid transit corridors based on the socioeconomic factors of surrounding neighborhoods. Lower-income neighborhoods often lack access to good, sustainable transit options, so this tool will be a way for Denver to intentionally address this disparity—and one that other cities can learn from.
At Tableau Foundation, “our whole approach is around using data for decision making,” Schumacher says. In the climate action space, we’re seeing how the traditional data on climate change, like sea-level rise and temperature increase, brought into conversation with data on communities and local needs, can transform into action. Climate change is an enormous challenge, but data gives us a place to start.
To learn more about our partnerships for climate action, visit: https://www.tableau.com/foundation/issue-area/climate-action
เรื่องราวที่เกี่ยวข้อง
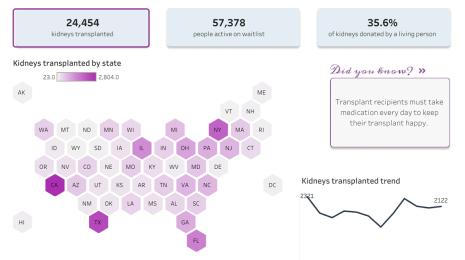
From Kidney Donation to Tableau Dashboard
 ตุลาคม 25, 2022

Using data to drive conversations about climate change
 เมษายน 28, 2022