Re-engineering a career with data and becoming a Tableau Visionary


To celebrate our Tableau Community in advance of Tableau Conference, we’re highlighting a few Community members who have re-engineered their career and life paths with Tableau. Adam Mico is a data leader at Moderna, and a Tableau Visionary and Ambassador. This will be Adam's first year participating as a Tableau Doctor at Tableau Conference.

When did you first find out about Tableau?
Adam: In 2014, we had training for work and were considering a different platform for our analytics since a lot of us were using Excel. I was known as the Excel wizard but was frustrated by its limitations.
That’s when Tableau was demoed at my work, and it was just light bulbs flashing all over the place. I was the only one in a group of maybe 120 or so people who were asking questions. I couldn't leave the guy alone because I was just so excited about the platform and what its potential capabilities were.
It was just like a big warm hug as soon as I got in. I was just so excited to be part of it immediately.
How did you become involved in the Tableau Community?
Adam: Flash-forward another five years. I was using Tableau a lot at work and I got a new job primarily because of the data analytics and Tableau work I was doing. I released some very large projects, re-engineering metrics and everything. I peaked at my role at work and was pretty much as high as I could go. I was kind of bored and didn't have much motivation, and I was looking for a way to give back because I’d been using Tableau for five years and didn't really know about the Tableau Community. I'd never attended a conference. I wasn't on Twitter. I wasn't on LinkedIn. The only place I was on social media was Facebook.
So I went into a Facebook group that was super helpful and super interesting called Tableau Magicians run by fellow Visionary Toan Hoang. After that, I was in. Within a couple months, I was helping administer a group, and then was nudged about becoming part of the DataFam on Twitter and LinkedIn. I finally bit the bullet and joined, and it was just like a big warm hug as soon as I got in. I was just so excited to be part of it immediately.
Tell us a bit more about your journey, especially what it was like building your first viz.
Adam: I developed a Tableau Public profile around the time I joined Tableau Magicians. Fortunately, it has evolved over time, and I’ve created a number of visualizations that have received a good following and good feedback. It helped me understand where I was lacking because I was really good at analytics when I started, but my design skills were not great.
In my first visualization, I was into the Billboard Album Charts. I created my own point system that I explained in clunky detail near the bottom of this visualization, which I would do much differently now. And there's a lot of green and golds (maybe because I am a Green Bay Packer fan) and all these colors I would never use anymore. But from an analyst perspective it was fun. Thanks to Sean Miller (another Visionary) for creating the data source to inspire me to produce publicly.
My viz took me a while and a lot of learning from other people in our Community. The science behind visualization helped me realize how important it was to create something not only nice-looking, but also something that uses Tableau.
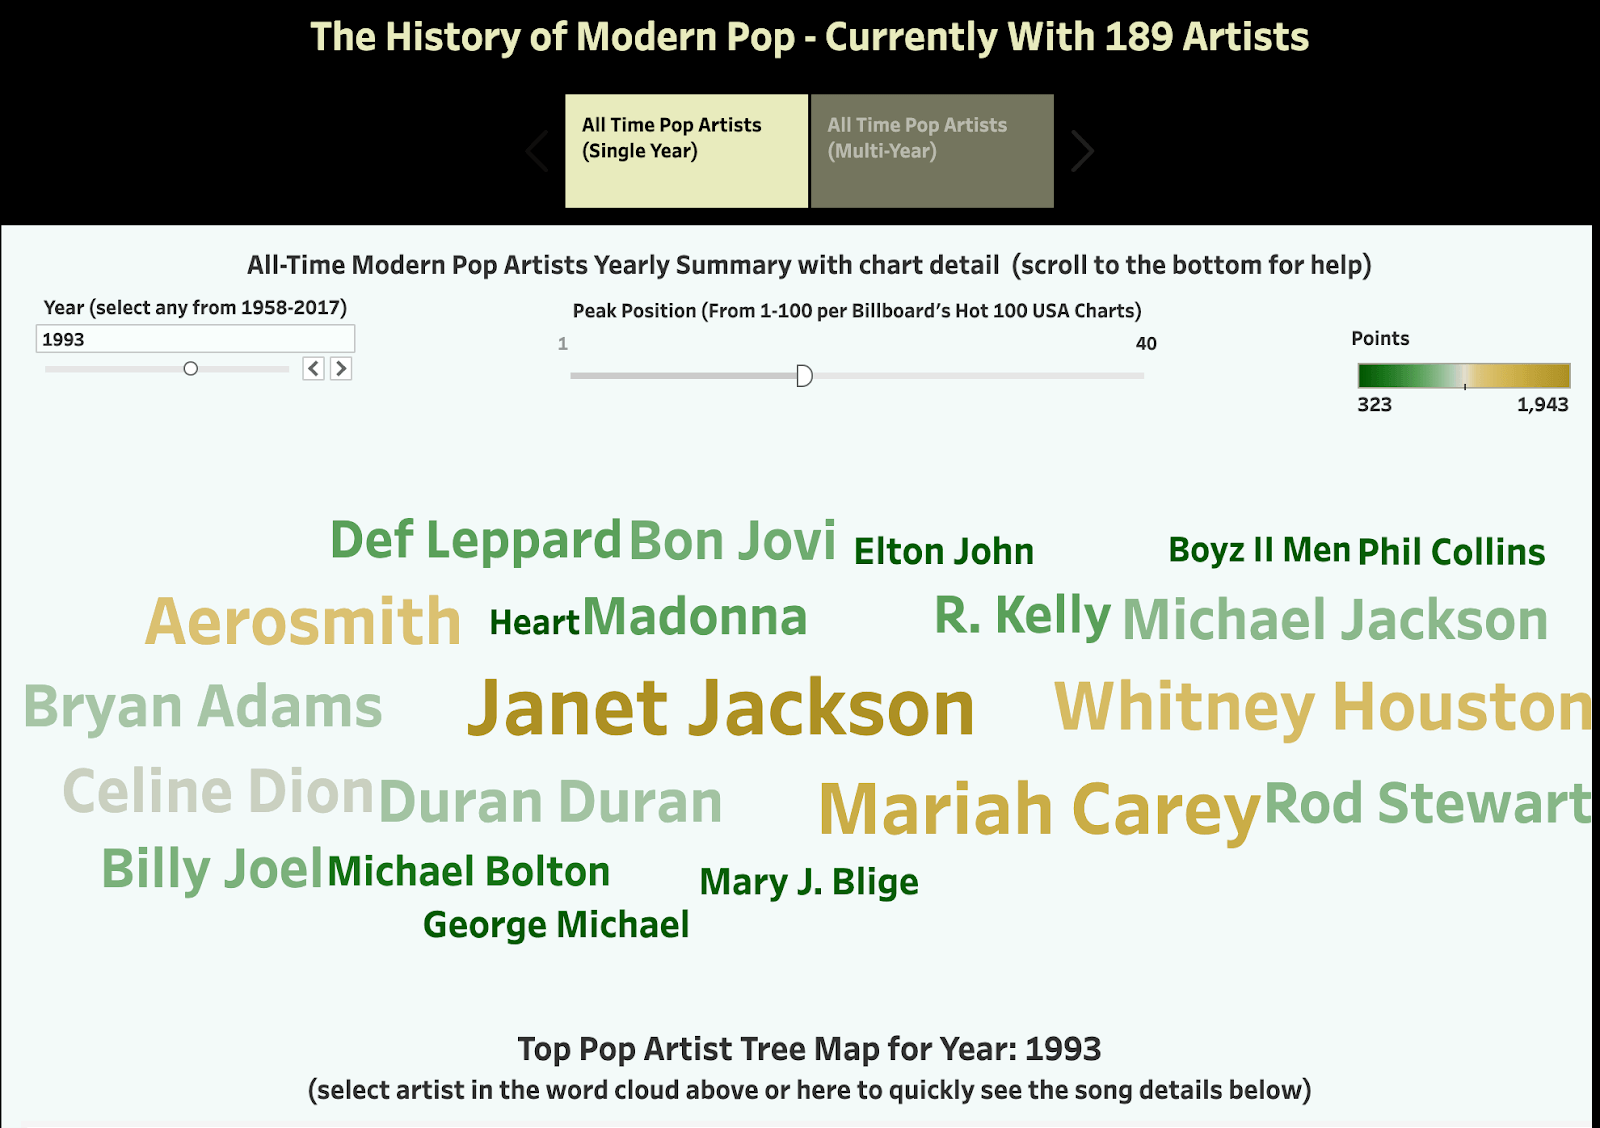
Tableau Visionary Adam Mico’s first visualization published on Tableau Public: "The History of Modern Pop (U.S. 1958-2017)”
What inspired you to keep going? Were there people or projects along the way to help you?
Adam: Oh, there's just so many. That's a great thing about our Community. It just keeps growing and it's super inspiring.
When I started, there were a few projects like Makeover Monday, Workout Wednesday and Sports Viz Sunday. Now there's like 20 initiatives going. Anybody with any interest could dive in and find something that's fun for them. Being involved with a number of projects and working with people and helping build initiatives with other people kept me going.
In addition, if you're on Twitter or LinkedIn your feeds are awesome. You're inspired every time you look at it. You can almost count on it like clockwork. You could walk away for 20 minutes, come back and you see something else that inspires you. So having that constant source of inspiration, especially if you're kind of down or tired or something, it can be a little bit intimidating, but also it can be really inspiring to understand and see what other people are doing to help you push toward your goals.
Tableau releases so much great stuff, but it's only as strong as the Community. That's the big difference between Tableau and basically every other software I've used – there isn't a Community like this anywhere else.
Sharing a lot of tips and tricks is another huge component, yes?
Adam: It is. Some of the best content comes from the Community as far as tutorials, visualizations, and points of inspiration talks on YouTube. Everything that is engaging and helps people skill up quickly has come from the Community. Tableau releases so much great stuff, but it's only as strong as the Community. That's the big difference between Tableau and basically every other software I've used – there isn't a Community like this anywhere else.
Since you discovered Tableau, have you implemented it in every single role and career move?
Adam: I wouldn't be part of a career that didn't incorporate Tableau. That's how much I love it.
Right now I'm more focused on data center enablement, but still highlighting Tableau as the tool. So I'm very involved with that, and helping build an internal community. So those are things that are really inspiring to me, because not only do I have the opportunity to continue to pursue my interests with the DataFam, I am also building an internal community based on everything I’ve learned from our external Tableau Community.
I wouldn't be part of a career that didn't incorporate Tableau. That's how much I love it.
You are a Tableau Visionary. What advice would you give from somebody new to encourage them?
Adam: When I started with the Community it was large, but it wasn't as global and it wasn't as diverse. Our Community is growing globally, and we're having a lot more impact from non-primary English speakers, which is great, and representation from other continents that weren't previously involved. For example, we're getting a lot of great Community members from Africa, which is so awesome, and also Japan, and pretty much every country under the sun.
The most inspiring part of my journey was helping create a blog post (“The #DataFam: 129 Authors From 21 Countries Spanning Six Continents Share Their 2020 Tableau Inspirations”) with Tableau Public Ambassador Priya Padham with a number of people sharing and contributing things that they were passionate about relating to our database and family.
And creating Tableau’s Next. There are so many people contributing to the Community and doing so many great things so I wanted to celebrate them. I created a blog post highlighting 65 newer Community members that didn't have a title like Tableau Ambassador or Visionary at that particular time, and some honorable mentions that are veterans of the Community, but don't have those titles as well. It's a showcase of them and being able to broadcast their talents and give them an opportunity to shine.
Can you share some of your favorite visualizations?
Adam: The first one is the chart catalog created by Kevin Flerlage, a compilation of charts by different creators. You can see so many great things in one visualization that inspires and also has a tutorial for each type of chart.
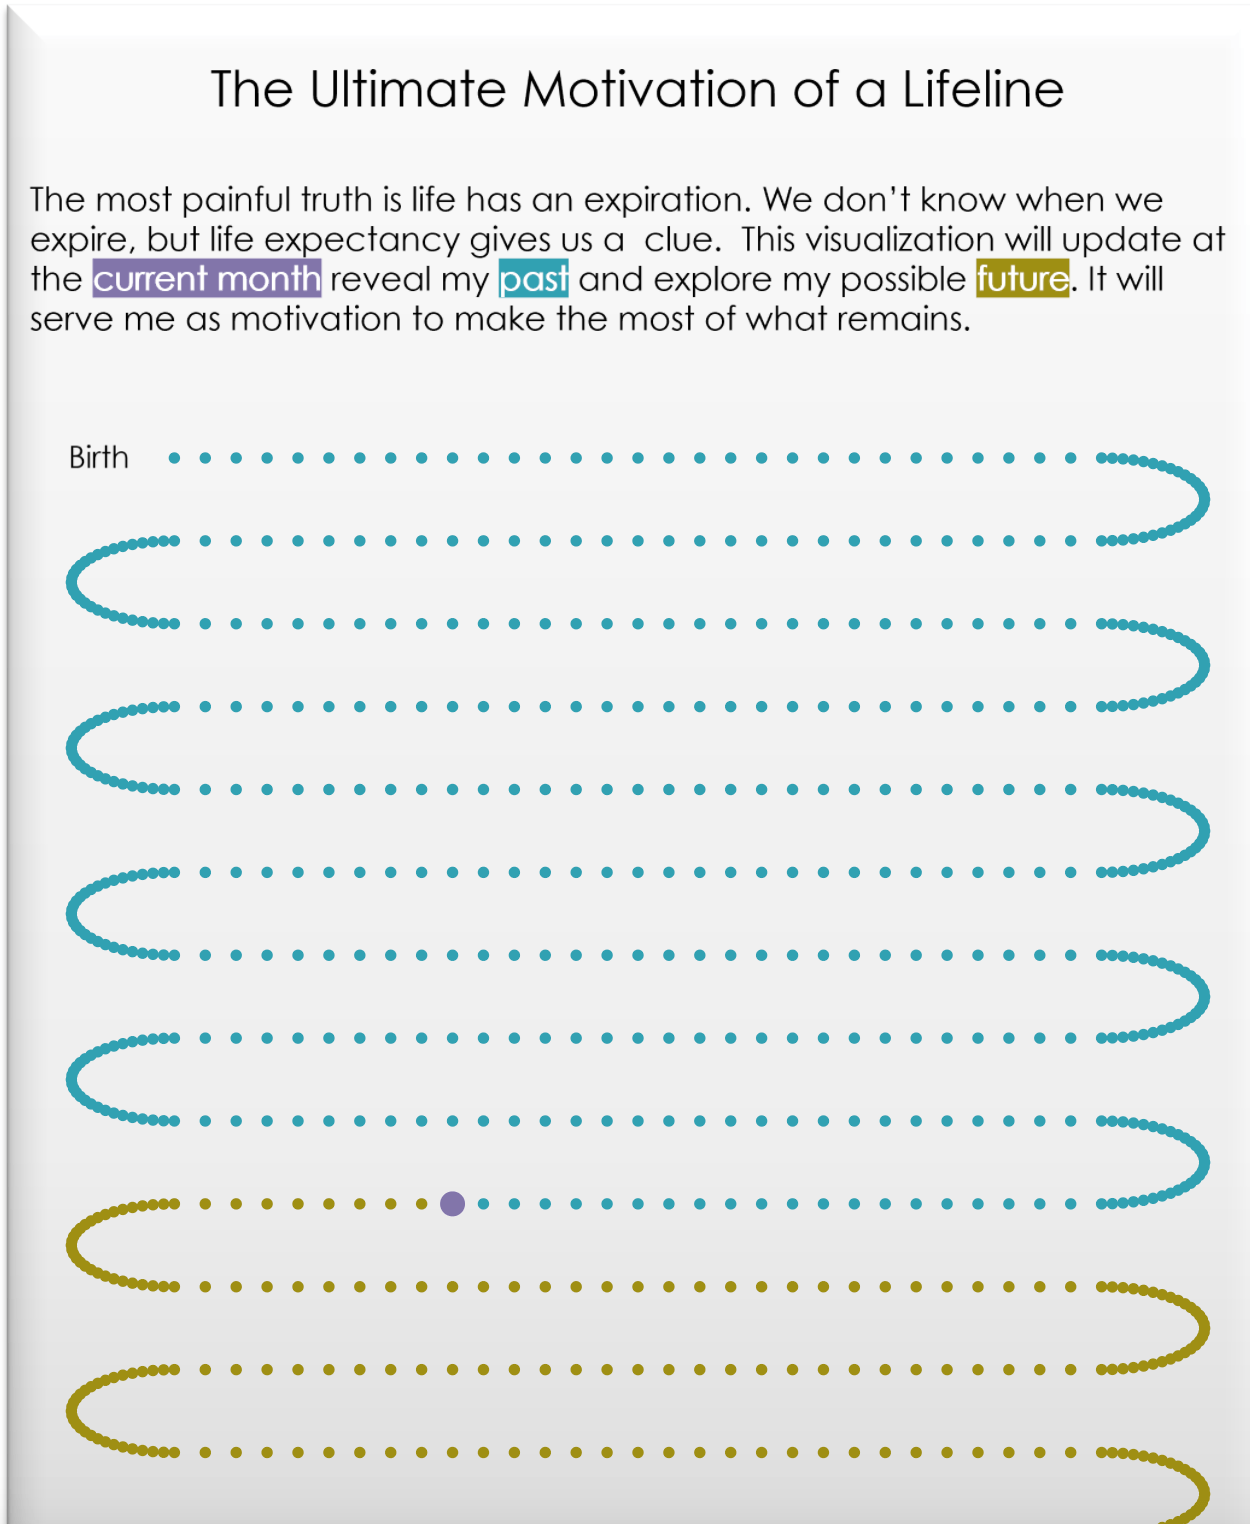
As far as a personal one, I created “The Ultimate Motivation of a Lifeline.” I wanted to do it a little bit differently and a little bit easier for me to follow and to give me some inspiration. One thing I learned with Tableau is that you apply Google Sheets at Tableau Public and it automatically refreshes. It's a simple visualization and each dot represents a month from birth. I researched my life expectancy so the purple dot represents the current month that I'm in. So it tells me what I’ve passed and where I'm going. There's so much left that I can aspire to and I always remind myself to keep stepping forward. I’m pretty sure that was my first Tableau Public Viz of the Day.
If there's anybody who is a little tentative about diving into the Community, what would you tell them?
Adam: It is scary. There are so many things going on in the Community. If you jump on Twitter, and you search #data, what you'll see is basically everything going up, you'll see some of the best visualizations that you didn't think were possible. You'll see so many resources, and it's just kind of overwhelming.
The easiest way to step into the Community is start attending a local Tableau User Group. There's many different virtual Tableau user groups that you can attend to get a vibe of what's going on.
I could tell you from firsthand experience, so many people in our Community are authentic and friendly. These are people who are very like-minded, and we're here to support you. If you go on Twitter, and you release a data visualization, or just want to be introduced to the Community, our bat signal is #DataFam. You can go on LinkedIn and do the same thing. Introduce yourself to us. My DMs are also open, and I'll be more than happy to help people find the Community and the resources accessible to them.
If you go on Twitter, and you release a data visualization, or just want to be introduced to the Community, our bat signal is #DataFam.
Can you share one of your best moments in the Community?
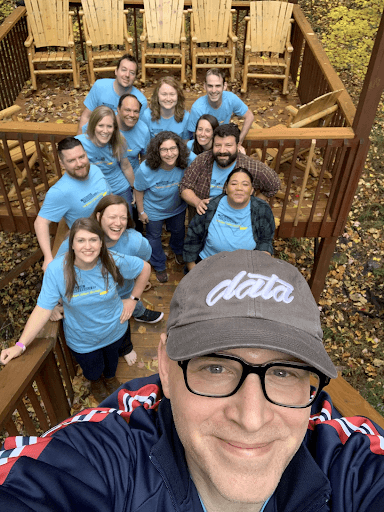
Adam Mico (front) and members of the Tableau Community: TC’21: Cabin Edition: Autumn Battani (Ambassador), Lindsay Betzendahl (Visionary and Ambassador), Michelle Gaudette, Katie Wagner, Michelle Frayman (Ambassador), Tim Cady (Ambassador), Cesar Picco (Ambassador), Karen Hinson (Ambassador), Luigi Cicciari, Brandi Looker, Corey Hanks, Vince Baumel (Ambassador).
The big highlight for me is last year. We didn't have an opportunity to go to the Tableau Conference, but around 20 of us got together to hang out in a huge Airbnb cabin. And we called ourselves #tc21cabinedition.
It's just so fun to meet with everybody and enjoy Tableau Conference together and have a real community. It felt like a micro-community event. We got to hang out, stay together for several days, and really enjoy the environment and have a fun Tableau experience.
Relaterade berättelser
Announcing the 2026 Tableau Visionaries
 18 Mars, 2026
Apply or Nominate to Become a Tableau Visionary
 18 December, 2025

Announcing the 2025 Tableau Visionaries
13 Februari, 2025