Charles Schwab Analyzes Call Center Data to Shape Quality Customer Experience with Tableau
Learn how Charles Schwab's contact center experience team analyzes call center data in Tableau to uncover clients feedback, questions, and responses to news, which impacts overall service.


The quality of a company’s customer service comes down to the details. Everyone can relate to calling into a customer service line. The first few interactions with a brand can make or break your perception of the company—and following voice prompts that lead to an unintended or incorrect endpoint can be frustrating and detrimental to that perception.
Charles Schwab is one of the largest publicly-traded financial services firms and data is essential across multiple departments. Schwab’s contact center team looks at how interactions (like the customer service line) affect the overall customer experience, using Tableau to dig deeper into feedback data from customer support calls.
Branden Fulton is a senior data analyst at Schwab, part of the contact center experience team. He and his team analyze call center data with Tableau to uncover what clients are saying about products, services, markets, and news.
“Our executive management team wants to know what’s happening on our phone systems and what our clients are saying,” shared Branden. The reports represent the voice of the client and appeal to a broad audience of users that range from those in the trenches who speak with customers by phone to executive vice presidents.
This involves collecting and digging into data from many sources including Hadoop, Splunk, Oracle relational databases, Teradata and others. Bringing everything together with Tableau and optimizing extracts on the Server means Schwab aggregates more extensive data pulls that call center staff access daily. Data quality is stronger too, as they collect details from customer conversations across the team and foster a collective understanding of customer support.
Understanding voice response to fulfill customer needs
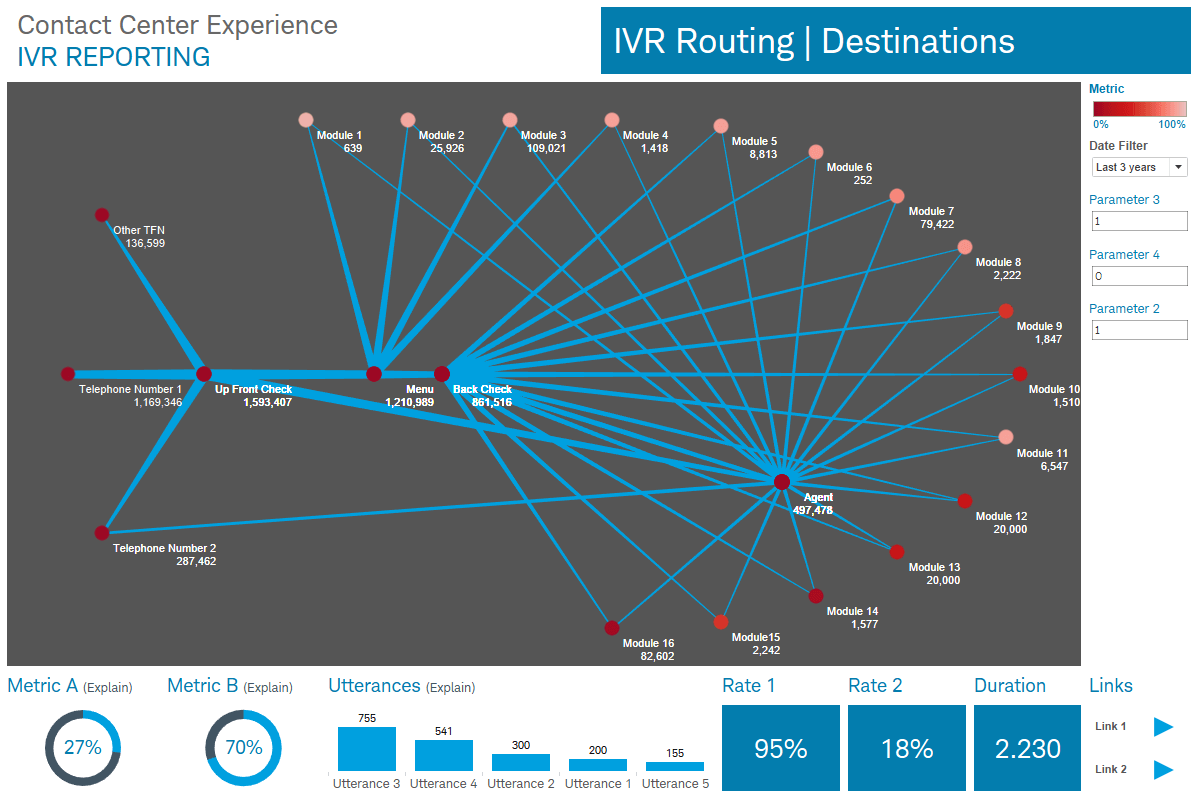
Making sense of phone conversation data is difficult, especially with tens of thousands of calls each day to the Schwab contact center. What callers say in Schwab’s interactive voice response (IVR) technology, the automated phone system, had been a black box for some time.
The contact center experience team understands the IVR. However, in circumstances where the IVR’s interpretation of calls wasn’t accurate, they had trouble deciphering intent and sometimes calls about basic tasks like a password reset were routed to the wrong staff. For instance, the IVR picked up the word banana instead of balances through customer’s voices or licensed professionals had to handle password resets instead of focusing on more difficult or technical trading needs.
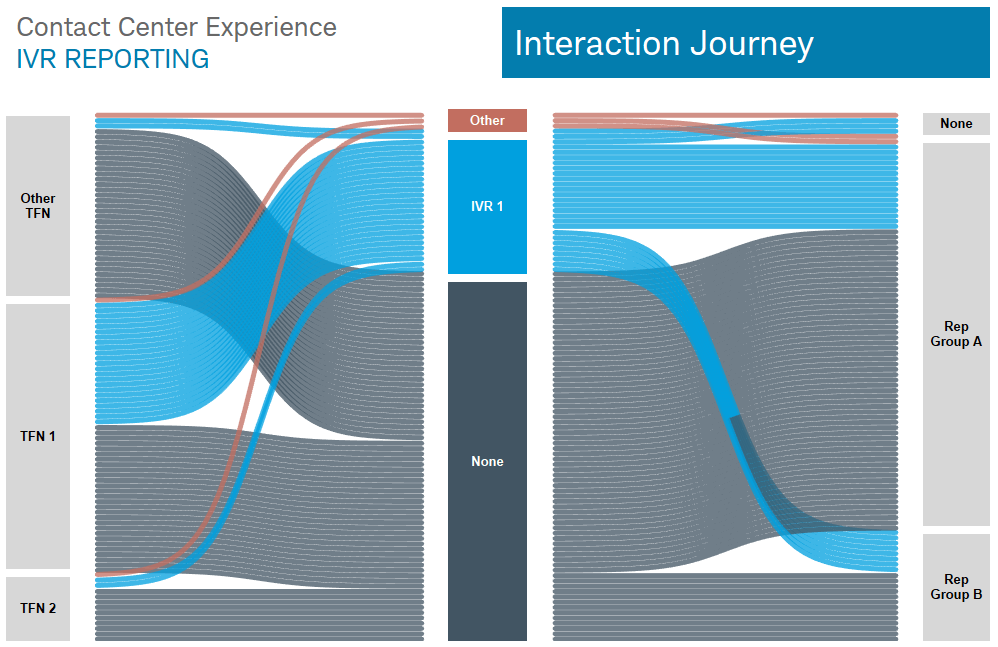
After collecting data from the IVR to understand where calls came from, what path customers followed in voice prompts to speak with a representative, who made contact with customers, and the outcome, they visualized all the data in a network diagram using Tableau. This helped Schwab improve its data quality and changed the way they focus on customers to enhance their Schwab experience. When working on process improvement projects like the contact center experience team does, seeing the flow of where calls go is critical as they interact with the brand.
Many team members were new to visual analytics, but they were able to get up to speed quickly with Tableau. “Now they’re listening to calls and layering the ability to use Tableau on top,” said Branden. They’re doing speech analytics and using Tableau to tap into that creativity.
They understand that call center staff don’t always look deeply into what’s happening when they quickly collect data and produce reports. Schwab’s previous view of customer interactions was static, but it’s now dynamic. Their network diagram in Tableau provides a quick, easy glimpse into data errors or inconsistencies and reveals the useful insights that help Branden’s team make important adjustments to best support Schwab clients.
Self-service analytics drives a better customer experience
Leadership support helped drive Tableau adoption and groups like the contact center experience team are empowered to produce their own reports and deliver a stronger, more personal experience for customers. For example, the IVR might recognize the customer needs to reset their password and change the experience.
Branden explains that without Tableau, they would take 20 steps backward in how they deliver customer support. As new Tableau features and versions are available, they also embrace them to provide the most recent content to users and keep everyone up-to-date. “Now those receiving and handling the customer calls are making their own impact, helping maintain higher customer satisfaction levels. They’re transitioning into a role where they’re looking at the data behind customer engagement.”
Center of Excellence creates strong Tableau community at Schwab
Tableau adoption at Schwab has accelerated because of their center of excellence. It includes a leadership committee of eight people from different parts of the company, managing directors and newer, entry-level positions bringing different perspectives around Tableau use.
They hold monthly user-group sessions where staff share their work and inspire others with new ideas or different approaches to Schwab data. Tableau training sessions complement the gatherings with users talking about data integration or demonstrating their unusual visualizations like Sankey diagrams. With stronger collaboration, Schwab has built a substantial Tableau community that actively participates in the broader Tableau community: “It’s been nothing but good feedback on Tableau. Every time we produce a new Tableau dashboard, people are just amazed with what we can put together and how quickly they can get the information they’re looking for.”
They also conduct monthly Tableau visualization competitions in addition to the user-group and training sessions. Participants are asked to extend outside of their usual data sets and produce a visualization that tests an unfamiliar or new tool or skill. The intent is that this helps them in their role and daily duties.
As a member of the leadership committee and representing the contact center experience team, Branden shared that they like to give something a little more complicated and something a little easier for beginners to support everyone’s needs.
With fast access to accurate data, the contact center team has the clearest view into customer needs. A new perspective now makes them critical stakeholders in Schwab’s data strategy and champions of change.
Learn more about how Charles Schwab has scaled Tableau across more than 16,000 users to date and created a center of excellence that is increasing data transparency as Tableau demand grows.
Relaterade berättelser
How EMD Serono is improving patient care with personalized, AI-powered insights from Tableau
 30 September, 2024

Embedded Analytics: Should you build or buy?
 7 Juni, 2022
Data fabric’s value to the enterprise
 11 Maj, 2022