How AI and Agentic Analytics Upend the Cycle of Visual Analysis—and Why It Matters


The Cycle of Visual Analysis is the time-tested bedrock of self-service data analytics. Furthermore, it’s been the foundational paradigm that Tableau has used to build products for decades. The thinking provided a dramatic advancement in helping more people in an organization see and understand their data. And as times and technologies are changing, so is the perception of how data analysts will interact with business-savvy users.
Fundamentally, the same core concepts of supporting non-linear data work will be core to the paradigm shift that is coming with the technology shift.
My role at Tableau has given me the opportunity to work closely with leaders in product development, like Ankita Dutta and Christian Hagel-Sørensen, to understand the implications and impact of agentic AI. Let’s get into what this means for the next generation of the cycle of visual analysis.
The new, agentic cycle of visual analysis
Data analysis is a non-linear process. For all people, it’s a process of answering questions with data, visually. This process doesn’t prejudice on role or technical ability. And while most data questions originate from business (or organizational) questions, the answers originate from the structure and semantics of the data and metadata.
For the business-savvy people in an organization, it’s a process of asking questions, getting answers, clarifying those answers to gain trust, and giving feedback. For data-savvy people in an organization, it’s a process of taking those questions, finding relevant data, and preparing it for analysis.
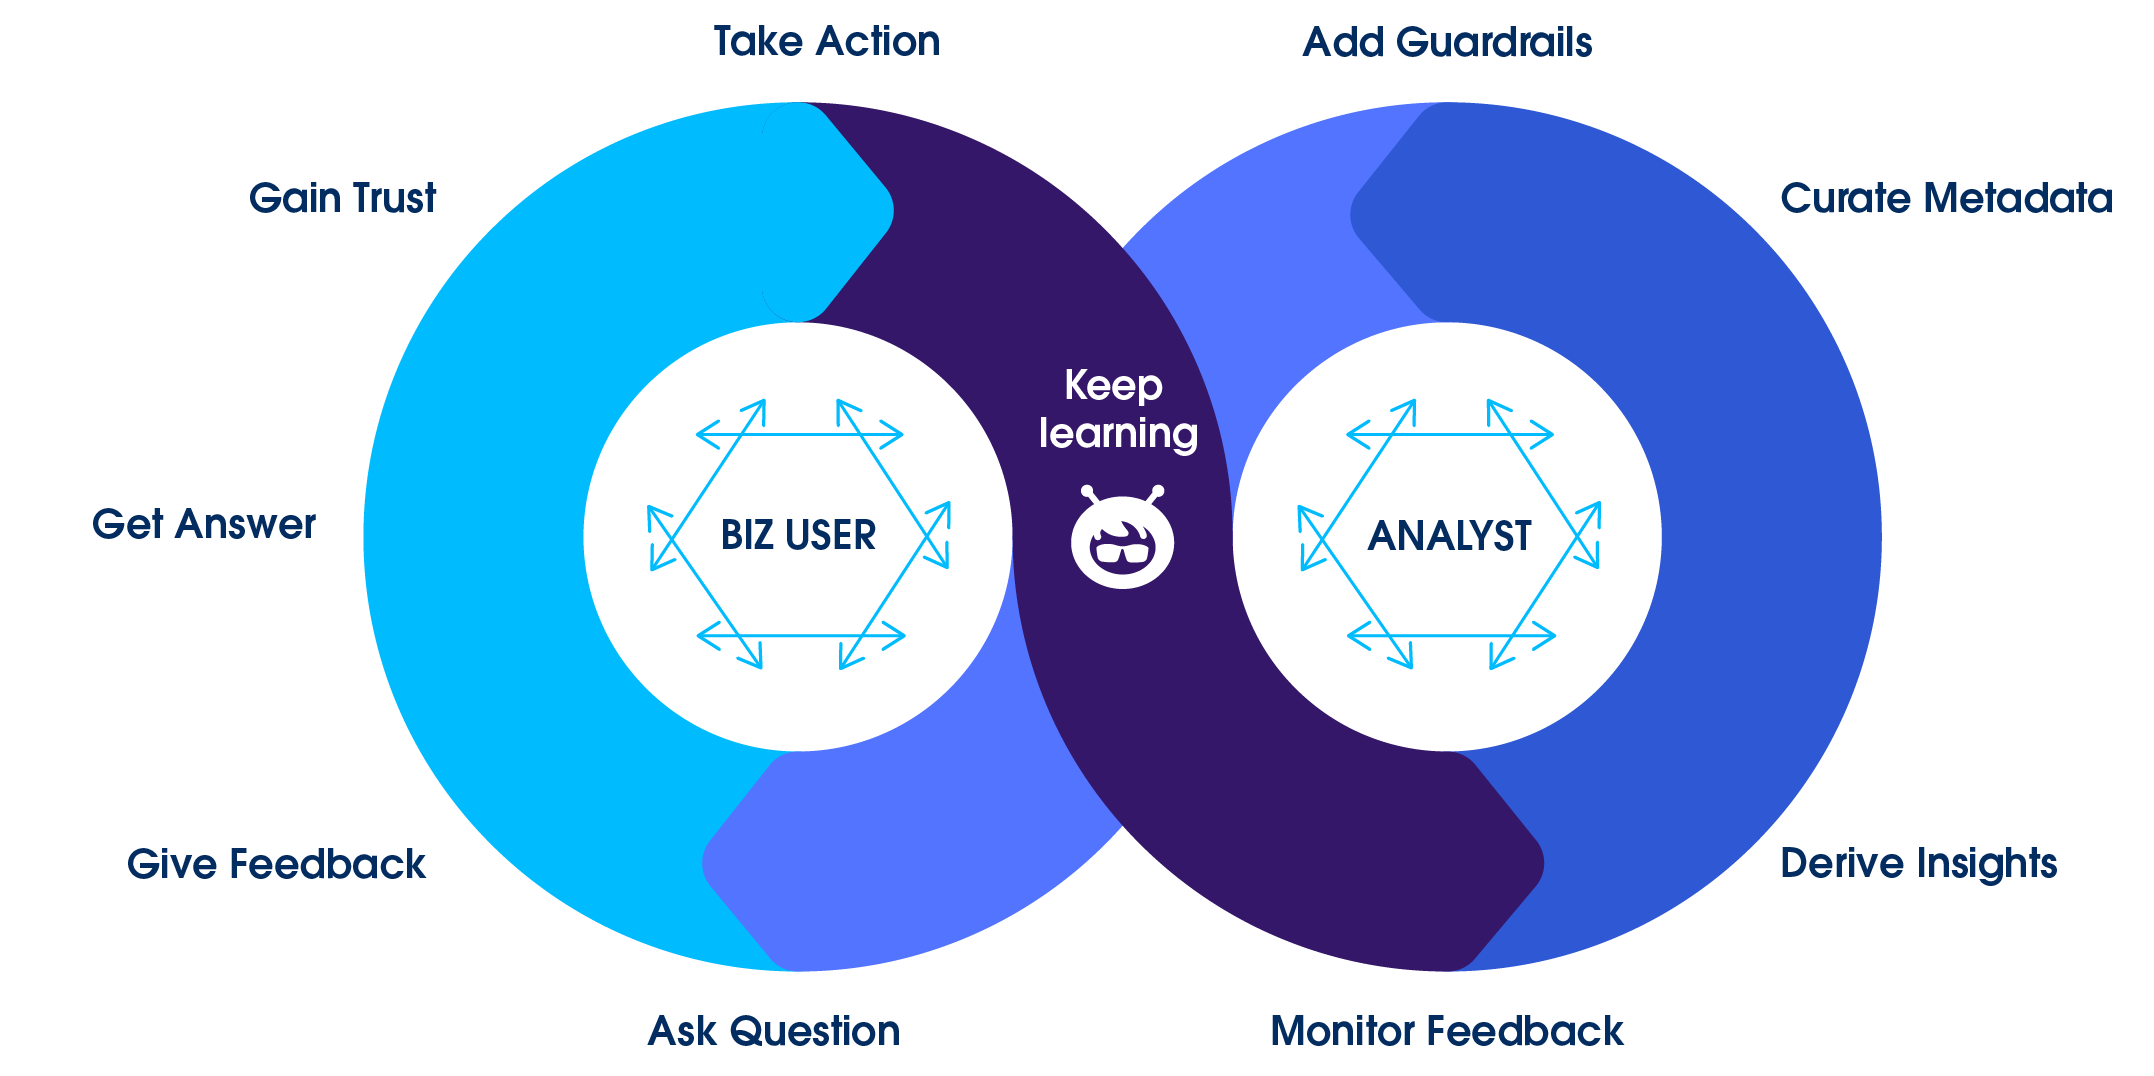
This relationship is tightly coupled. And the bond will be facilitated by AI agents, taking the business-savvy questions and answering them with the context of the data-savvy work. And through this bond is where trust is gained—through collaboration and by integrating feedback through additional data insights, structure, and curation.
The business-savvy cycle
Start with questions
Whether the questions are recurring (“What was my call volume last week?”), seasonal (“How are Black Friday sales going?”), via intelligent alerting, or otherwise; the cycle starts with a task or business question that needs to be answered. Sometimes, the question is well understood, but the answer and the underlying data may not be. This is what leads a person to the non-linear path towards finding and trusting an answer. Other times, people don’t know what questions they should be asking. So having the system proactively offer starting points for analysis—whether as questions or even a recommended visualization—can help users onto a path of discovery.
Give feedback
Often it is the case that the original question might not be clear in its intent, which will spark a conversation to clarify that intent. This can be done in a number of ways, but is usually facilitated through a conversation that aims to:
- Better understand the semantics of the organization—such as comprehending and deconstructing an industry-specific or internal acronym.
- Build a set of examples and ask for feedback on them—which could be providing open-ended prompts like "I want the data to explain [...]", rather than “I want a bar chart sorted by [a specific field].”
- Use examples by sharing existing dashboards and metrics.
Get an answer
Through that conversation an answer will be derived. And that answer will come with varying levels of trust, depending on the circumstances of the original question (are you taking a quick health check, or are you building a quarterly SEC report?). While an answer is the logical response to a question, that answer might lead to new questions whose answers are equally important to properly shape the next action or decision.
Gain trust
Gaining trust is a multi-faceted venture. It could be done through collaboration—having another trusted party come in and validate the results—or through tracing the chain of thought of how the logic was broken down to translate the question into the answer. And this could trigger another flurry of questions and answers. All of this is needed to increase the confidence required to then take the most appropriate action.
Take action
Once you have an insightful answer that you trust, taking action is the next step. This could be anything from doing nothing, to starting a conversation with colleagues to discuss, to initiating automation and workflows that alter a business function.
The data-savvy cycle
Monitor feedback
To monitor feedback is to understand the context of the business, what questions are being asked across the business, and to use that as information to help curate your data ecosystem in a way that’s structured to best answer those questions. This is done via steps like:
- Learning more about business users’ experiences and trying to speak their language.
- Asking open-ended questions like "What do you want this dashboard to tell you?" or "What question do you want to answer?" rather than "Do you want a line graph?" or "Should I make a trend line?"
- Using examples—show existing analyses and ask users what would make them better.
Derive insights
Data professionals follow several key steps that help transform raw data into meaningful understanding:
- Discover data: Finding data tends to be an overwhelming challenge because organizations often have vast, complex datasets spread across multiple sources, making it difficult to locate the right data quickly. The first step is understanding the data catalog or schema, which helps identify available tables, fields, and relationships before analysis.
- Get data: Knowing where to find the right data is one of the biggest obstacles to becoming data driven. With specific data sources cataloged, prioritize the most impactful ones and use those to understand how to get data to answer new business questions.
- Choose visual mapping: Content creators explore data by adding measures and dimensions to the view, and Tableau presents the most effective visualization, which can be changed anytime. There are five primary types of visual mappings: comparison (bar), spatial (map), temporal (line), compare two measures (scatterplot), and precise number (text table).
- View data: Visualizations highlight unexpected data, encouraging further analysis. The interactive model, based on incremental change, allows users to explore various visualizations and refine questions into answers. This approach enables everyone, not just analysts, to learn visual analytics and make data-driven decisions.
- Develop Insights: Visual analytics streamlines finding and communicating data insights, but users must think critically about the data's usefulness, accuracy, completeness, and potential biases.
Curate metadata
Metadata is the instruction set needed to help discover new insights,. whether that’s to help increase the relevancy of search results or to help ground AI with factual context. This is the act of providing the metadata (and therefore business context) to your organization’s data—field descriptions, aliases, business qualifiers, model descriptions, and much more.
Add guardrails
A guardrail is a set of guidelines and constraints designed to ensure responses are within the constraints of specific use cases. Knowing what bias to avoid, what types of questions not to answer, and how to respond in specific contexts are all important elements to fast, more deterministic, and trustworthy responses.
The AI agent bond
These cycles existed prior to the invention of reasoning-based AI agents. Yet it’s the time-distance between the two cycles that has been the largest barrier for the business savvy to make quick, data-driven decisions. And it’s been advancements in technology that are able to bring those closer together. For example:
- 100 years ago, data was largely captured on paper. When there was a data question asked, it took a human to file through the paper and manually tabulate an answer. An iteration took months.
- 50 years ago, mainframes were more commonplace, replacing that paper with databases. When there was a data question, it took a request to the IT team who would query the database and return a printed report. An iteration took weeks.
- 20 years ago, Tableau democratized data access allowing business-savvy people to ask analysts, who used visual analytics to quickly and collaboratively answer the questions. An iteration took days.
- Today, business-savvy people can ask questions of agents, who are grounded with metadata and context from the analyst, who can immediately answer data questions visually in the flow. Iterations take seconds.
The time gap between a question being asked and an insightful trusted answer being given is the main factor in whether decision makers feel empowered to make data-driven decisions. Each time that gap is reduced, more people make data-driven decisions.
Agents will produce this final reduction in time, empowering the business savvy to ask questions and get immediate and trusted insights; and the data savvy to continue to curate and govern data and metadata to continue to improve the system, increasing accuracy and trust in those answers.
Agentic analytics represents a new paradigm for business intelligence. Read more about Tableau Next, the world’s first agentic analytics platform.
Relaterade berättelser
How to Set Up Intelligence Briefs with Tableau Next and Slackbot Skills
 8 Juli, 2026

Top Announcements from Tableau Conference 2026
Trusted Knowledge Drives Smarter Decisions—How Tableau Approaches Agentic AI Differently
 5 Maj, 2026