Monitor your AWS spend in Tableau with these cloud cost and usage reports
Want to optimize your AWS cloud spend? We created a simple workflow to track cost and usage in Tableau.


Tableau is committed to providing first-class support for our customers running their businesses in the cloud. No matter where you are in your cloud journey—freshly migrated or a cloud veteran—we understand there are several needs that remain consistent and pressing for IT to minimize risks and maximize your investments in the cloud. According to RightScale’s State of the Cloud report, top amongst them year after year is the ability to more effectively manage and optimize your organization’s cloud spend.
As part of Tableau’s ongoing partnership with Amazon we have invested in providing IT departments and stakeholders with a solution to help manage your Amazon Web Services (AWS) costs. This solution is relevant not only for customers deploying Tableau Server on AWS, but if you rely on any AWS services—compute power, databases, IoT, machine learning, and beyond.
AWS generates extensive data while tracking the activities in your AWS environment. We’ve created a workflow to connect directly to this valuable data from Tableau. From there, Tableau’s rich analytic capabilities allow you to investigate this data in great detail and communicate that information across your organization to help drive key business decisions.
As part of our initial solution we’ve created several sample Tableau dashboards to demonstrate the type of analysis you can perform on this data. The following dashboard is an example of the type of “landing page” we often create for team leaders at Tableau. It quickly gives you the important metrics relating to your AWS deployment and provides interactivity that allows you to drill in and answer additional questions.
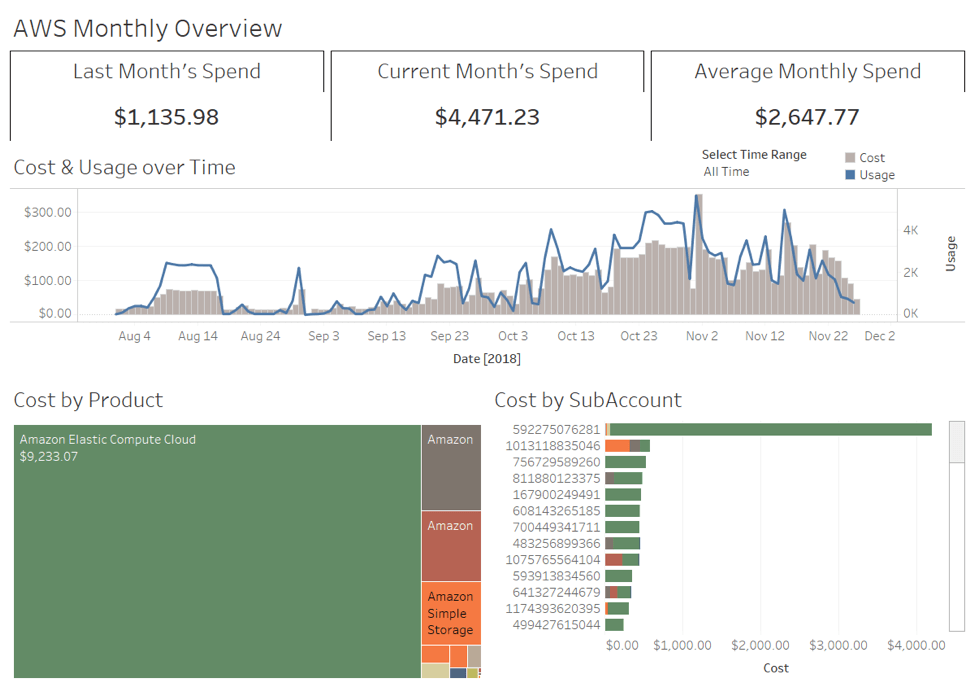
This dashboard can be used to investigate peaks in usage, identify stray instances, and track spending trends. We have implemented a version of this dashboard internally at Tableau to monitor AWS usage across our consulting team. By hosting the dashboard on Tableau Server we take advantage of several additional features. Setting up data-driven alerts gives us real-time notification if our AWS spend crosses a given threshold. Implementing user-based filters ensures that individuals don’t have access to sensitive information while also allowing managers to oversee their teams’ activities.
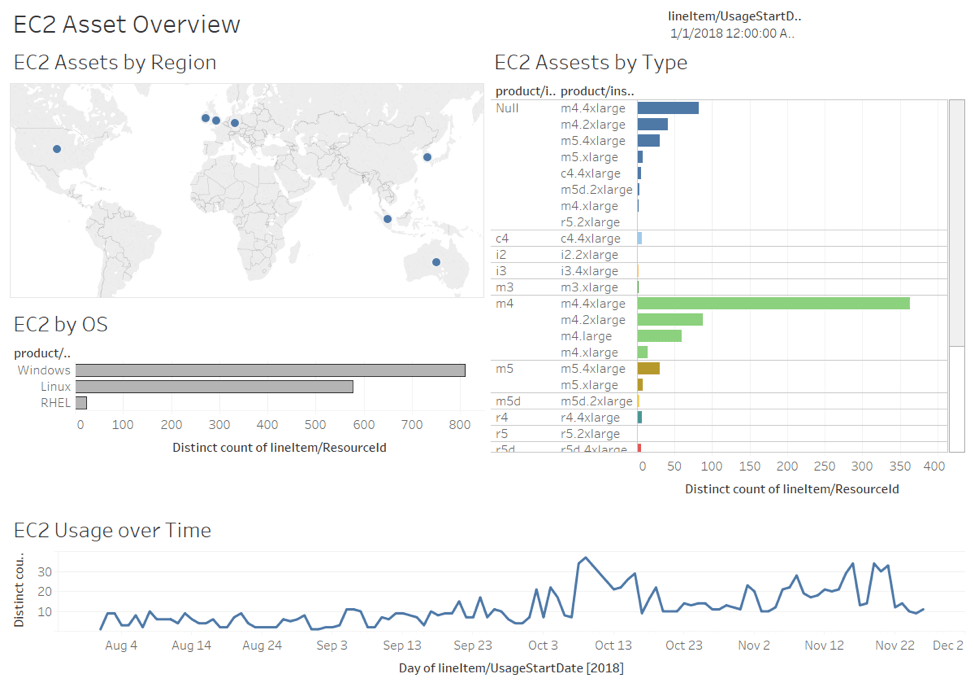
Many organizations also want to monitor more specific elements of their AWS deployments. Perhaps your company relies heavily on AWS databases, like Amazon Simple Storage Service (S3), or Amazon Elastic Cloud Computing (EC2). A dashboard like the one below gives you a more detailed view into a specific resource. Its interactivity enables a wide range of users to ask and answer questions about their AWS usage.
Looking forward, cloud deployments will only grow in size and complexity. We need to match that growth with increased transparency, governance and understanding. These sample dashboards are intended to give a brief glimpse into the value of using Tableau to analyze your AWS spend. However, every organization has different needs, structures and questions—the true value of this solution comes when you connect to your own AWS data and begin asking and answering questions about your business.
Getting started: How to set up AWS cost reports in Tableau
Included below are instructions on how to set up cost reporting. Access a downloadable sample workbook and SQL file alongside these instructions on our AWS Cloud Monitoring Dashboards page.
Part one: Enable cost and usage reports in AWS
- Create a new S3 bucket to store usage reports with default permissions. Follow the steps here.
- Create a new AWS Cost & Usage Report. Follow the steps here. A few things to note:
- Reports are only available in a master account—not linked accounts.
- Select “Amazon Athena” for Enable report data integration for—the default file format for this is Parquet.
- Reporting begins within 24 hours of creation. You might not see files until tomorrow.
Part two: Connect to cost and usage reports with Tableau via Amazon Athena
- Download and customize the create-usage-table.sql file to reflect the S3 location of the reports enabled in part one.
- Update LOCATION to the S3 bucket where the report Parquet files live. (The format is “s3://
/ur/ / ”) - Execute the Athena query to create the table.
- Open up the Query window in the AWS Athena console.
- Copy and Paste the updated SQL into the query editor.
- Click Run Query. This should take about two seconds.
- Add partitions. Run the following query to add partitions to the table: “MSCK REPAIR TABLE cost_and_usage;” Please note: You have to rerun this command anytime a new partition is added (each month).
- Connect from Tableau Desktop.
- Download necessary drivers. Read more here.
- Open Tableau Desktop.
- Connect to Athena data source. Read more here.
Part three: Load your data into the provided sample Tableau workbook
- Download and open the sample Tableau workbook AWS Cost & Usage sample.
- Add the Athena connection that you created in the previous section as a new data source.
- Replace the “Cost & Usage Sample” data set with the Athena connection. Read more here.
- Click through the sample dashboards to repopulate with your AWS data.
Monitor more than cloud data with performant IT analytics
Arguably, IT knows the value of data and being data-driven more than anyone, as you not only collect and store data for the organization, but also use data to deploy, operate, and support the business as its needs evolve. We know it’s important that you make proactive, data-driven decisions as a part of monitoring and managing the tools that power your organization.
With Tableau, you can keep a pulse on all of the systems that enable your workplace—from AWS to ServiceNow, Jira, Splunk, and more. Unleash new power and speed to simplify your work with interactive dashboards, data-driven alerts, and enterprise-grade security and governance—learn more here.
Relaterade berättelser

Supercharge Analytics with the Power of AWS-Hosted TabPy
 14 Oktober, 2024

Tableau Now Available Through AWS Marketplace
 5 Februari, 2024
Tableau + AWS: Accelerating your digital transformation with Modern Cloud Analytics
 27 November, 2023
Tableau and AWS help customers digitally transform with Modern Cloud Analytics, combining technical resources and expertise with our vast partner networks.