Tableau 9 preview: Introduction to Level of Detail Expressions


At Tableau, we think about the future needs of our customers just as much as their current needs; each new release is designed to enable deeper insights. In the previous Tableau 9 blog post on Analytics in the Flow by Ian A. Coe, you saw how we are making calculations faster, easier, and more delightful to create and use. Today we are going into more detail about an addition to the Tableau calculation language: Level of Detail Expressions (LOD Expressions). The language changes are small, deceptively small, but their impact on your data analysis will be profound. Level of Detail Expressions (LOD Expressions) in Tableau 9 will enable richer and more reusable visualizations.
This is one in a series of posts on Tableau 9, currently in beta. Read other posts on Tableau 9:
- Automatic Data Prep
- Query Performance Improvements
- Smart Maps
- Analytics in the Flow
- Server Admin Views
Let’s review some of the concepts and terminologies, and then look at some examples.
Often, the challenge in data analysis is taking a question that is easy to articulate in spoken language and then answering that question with data. Tableau allows you to provide the answer as a visualization. The analysis frequently requires comparing or referencing data at multiple different aggregation levels. The primary focus of the visualization may be at one level but the question may reference another level. For example, you are visualizing sales revenue at a country level on a map, but you want to compare those sales to the global sales number.
In Tableau, we refer to the main visualization aggregation level as its "level of detail". LOD Expressions allow us to look beyond the visualization level of detail. The data in the visualization is often a result of filtering the data from the data source. LOD Expressions can look at the data before it is filtered – that enables more powerful analyses.
First, let’s consider some typical analytical questions. They are easy to express in everyday language:
- How do Country Sales contribute to Global Sales? I want to see the relative performance of countries with respect to my global sales.
- I can see how a state’s actual profit compares to the target, but what percentages of products in each state hit, or miss, their own target?
- How does customer tenure affect purchase size?
Each question has a clear focus or context.
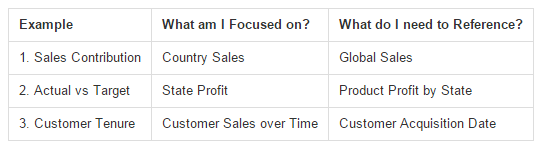
I have chosen these examples to illustrate the different types of references to other Levels of Detail. The first question looks up a at a higher level of detail. The second looks down at a level of detail below my current level. The third compares two sets of data at the same level of detail. We are comparing and contrasting. From contrast comes clarity. From data comes meaning.
Let’s look at the examples in Tableau 9 to get a look at how we answer these questions using LOD Expressions.
1. Sales contribution
We can use a map to visualize a country’s sales revenue contribution to the global sales revenue. If we color by the contribution percentage then darker colors equate to a higher contribution. When we look at all markets, we see that USA has a large contribution (18%) to the global sales revenue.
Suppose you want to focus on an emerging market like EU that, in absolute terms, has a small sales contribution. With a LOD Expression we can filter on the EU market, and still measure the global contribution.

The thing to note is that the global sales revenue is not in our visualization after we filter to the EU market, but we can refer to it using a LOD Expression. You can see the LOD Expression on the How To, but don’t worry too much about the details. We will cover the syntax and usage in more detail in future posts. The key concept is that we are focusing on Europe while referencing global sales. We have filtered non-Europe data out of the view but we can still reference the sum of global sales.
2. Actual vs. target
In this visualization, we are charting the difference in actual profit compared to target profit for a chain of coffee houses. We can clearly see which states have exceeded the target and which states missed the target. We manage and report these profit variances by state, but we might also be interested in product profitability within each state. We could select each state and see the detail. That’s a typical drill-down feature. We can do better.
In the next chart, we use a simple LOD Expression to calculate the percentage of the products within each state that meet their target profit.

Now we see that Massachusetts, while beating the state target, has a relatively small proportion of products that are meeting their target - that would surely warrant further investigation.
In this example we are highlighting profit variance at a lower level of detail (Product) than the visualization level of detail (State). With the LOD Expression we have added product to the state variance calculation.
3. Customer tenure
LOD Expressions can be combined with other types of calculations, and they can be reused. In this example we combine the LOD Expression with a table calculation to provide a powerful visual insight.

Our LOD Expression calculates the date of first purchase for each customer. This allows us to visualize the cohort of customers that share the same year of first order. We can then view our sales revenue and percent of total sales broken out by each cohort. The same LOD Expression can be reused. For example you can use the same expression to define a cohort of customers by month of acquisition.
This has been a very short introduction to LOD Expressions. Look out for more blog posts from our Community Zen Masters and Team Tableau. You will learn how to combine LOD Expressions with the other new and existing Tableau features to create delightful visual analyses. You will see more advanced techniques for binning, proportional brushing and more extensive cohort examples.
Then it will be over to you to create the future. We can’t wait to see what you do with LOD Expressions and the other 80 new features in Tableau 9.
Relaterade berättelser

5 Ways to Use Tableau Public to Achieve Your Goals
 11 Januari, 2025

World Mental Health Day: Elevating Awareness Through Data Visualization
 10 Oktober, 2024

From TV Screens to Tableau: Visualize Your Favorite Shows with IMDb
 31 Augusti, 2024