Vicinity Centres takes insight-driven approach to retail asset management
600 active users of Vicinity’s Tableau insights portal
300+ live dashboards supporting data-driven decision making
Positive outcomes across the business, including a 36% improvement in debt position and significant avoidance of energy costs

Vicinity Centres is one of Australia’s leading retail property groups with $22 billion in retail assets under management across 60 shopping centres in six states. These centres include premium locations like the Queen Victoria Building in Sydney and Australia’s number one retail destination, Chadstone – The Fashion Capital.
Shopping centres are a complex ecosystem of retailers and customers, with financial performance influenced by geographic location, demographics, and the mix of retail stores. Understanding these complex influences is crucial for making effective decisions around marketing, leasing, centre development, and capital allocation and that’s one of the reasons why Vicinity has been steadily building its in-house data science and insights capabilities.
There’s always been a real desire within the business to leverage data and analytics and provide greater value to our retailers and customers, but there just wasn’t the means to do it. Tableau has helped fill that void by allowing us to push data out to everyone in a way that’s easy to consume and applied to any given situation.
Improving data access
With Tableau, Vicinity’s centre management and leasing teams across Australia can now access a range of data points to better inform decision-making and help manage initiatives like social distancing inside shopping centres. Some of these data points were previously siloed in spreadsheets while some were simply not captured at all.
“The journey we’ve been on has been about putting as much data as we can in the hands of our people so they can make more informed decisions. Alongside this, there’s been a real effort to improve our data collection,” said Coleman.
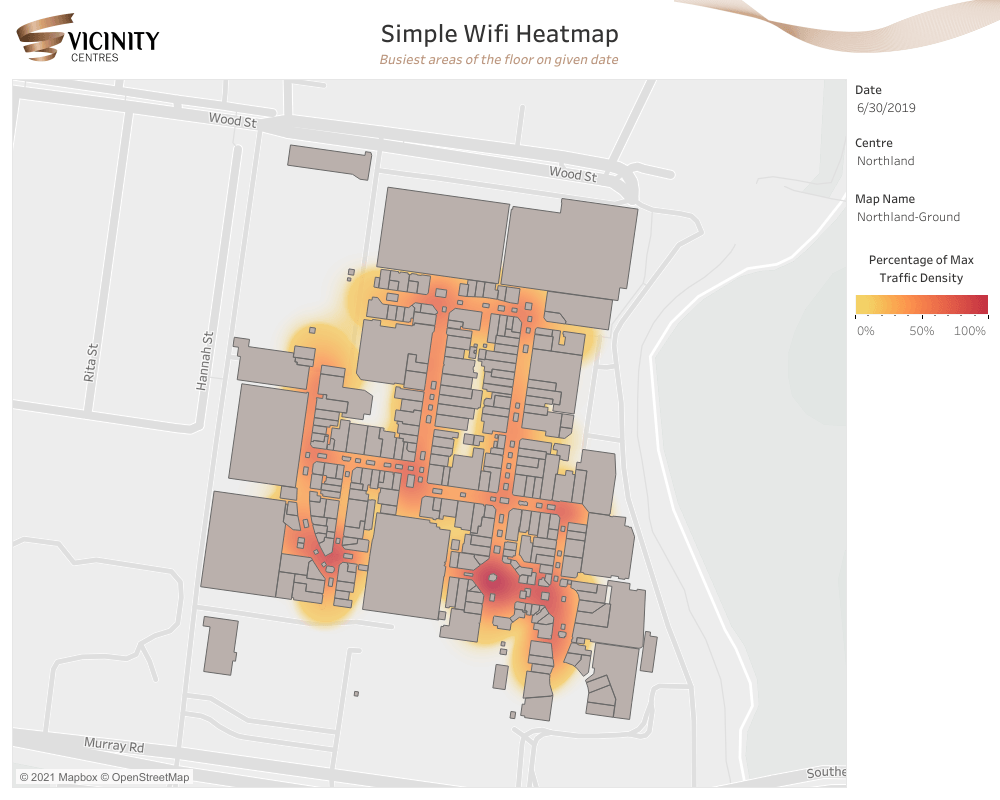
As an example, Vicinity has installed traffic counters at each shopping centre to gather robust data on footfall. It’s also expanded its collection and analysis of Wi-Fi data, bank card transaction data, demographics, and mobile phone location data to create insights that can improve retailer and customer experiences.
All data is stored in a centralised data lake, with a data warehouse on top containing more usable datasets, including machine learning and forecasting models. Tableau is used to visualise these datasets and provide business users with easy, immediate access to insights.
For instance, leasing executives now have a suite of Tableau dashboards that enable
interactive analysis of tenant performance, examining specific stores, categories, centres, and retail brands. The insights gained help to ensure each retailer is placed in the right location for more sustainable profitability allowing Vicinity to leverage the full value of their shopping centre space.
Evolving the data culture
Vicinity’s adoption of Tableau has scaled from 130 licenses in 2015 to 750 licenses as at September 2021. The majority of these licenses are held by Tableau Viewers who are able to access more than 300 live dashboards from Vicinity’s Tableau insights portal.
The portal—accessed via the Vicinity intranet—was developed leveraging best practice from Tableau on how to establish an effective folder and permissions structure. It features groups and sub-groups linked to topics and job roles and includes links to educational resources for new users. And while onboarding was a challenge in the beginning, the use of the portal has grown to include more than 600 employees and receives more than 30,000 dashboard views monthly.
One of the hurdles to onboarding was familiarising users with a whole new way to access data. To help, Vicinity created online training videos and set up a dedicated Tableau support email. It also established a Tableau Creators group in Microsoft Teams to share updates, events, and training opportunities.
Awareness and uptake of Tableau has also grown as a result of the platform being embedded into key business processes like Vicinity’s shopping centre budget and planning process undertaken semi-annually.
Encouraging adoption has become easy over time as people can see the benefit of being able to quickly jump in and self-service as opposed to trawling through different folders and spreadsheets or engaging an analyst. We now have hundreds of people in different offices accessing data in the same way, using the one source of truth and I think that’s one of the greatest advantages Tableau brings to an organisation like ours.
Driving business outcomes
In addition to pushing out data for daily analysis and reporting, Vicinity’s Data Science & Insights team has leveraged Tableau to support a number of key initiatives. One of these is an ongoing drive to reduce consumption of energy which has both an impact on environment and profitability.
Vicinity particularly wanted to reduce peak consumption, on which energy tariffs are based. This in mind, the Data Science & Insights team built a machine learning algorithm to analyse factors like footfall, weather, day and time, to forecast energy demand 24 hours in advance.
The forecasts, which are visualised using Tableau, are then used by centre-based operations teams to enact strategies that reduce peak consumption. This initiative has resulted in significant cost avoidance as well as additional analysis to optimise use of solar energy and help Vicinity in its pursuit to achieve net zero carbon emissions.
Tableau has also been leveraged to navigate the impacts of COVID-19. For example, Vicinity has created a Vision, Strategy, Action plan KPI dashboard to track COVID-19 recovery and general shopping centre performance. Additional dashboards help Vicinity track and manage leasing performance which has been particularly complex during COVID-19 due to the need to more closely monitor retail debt, store closures and COVID-related lease variations.
Previously, debt data was difficult and time consuming to track. However, with COVID-19 it became a business-critical metric, leading the Data Science and Insights team to collate the data into its data warehouse and provide stakeholders with curated dashboards based on their role within the debt reporting and collection process. Actions triggered by this data contributed to a 36% improvement in Vicinity’s debt position from May 2020 to May 2021.
Another key initiative related to COVID-19 has been the use of Tableau dashboards to help manage social distancing and keep retailers and consumers safe. For example, over the 2020 Christmas period, Vicinity used Tableau to analyse Wi-Fi location data and identify areas of concern and understand how much traffic could cause them to become congested.
Key stakeholders were then informed of areas of concern and provided with a near-live dashboard showing current and predicted levels of traffic. This data-driven approach not only helped Vicinity navigate the Christmas period without issue, but also gave the business a competitive advantage through extensive media coverage and public commentary.
Increasing impact
While Vicinity has established a sophisticated data science capability and an increasingly data-driven culture, it sees many opportunities ahead. For example, there are many processes within Vicinity that could benefit from data automation such as automated pricing recommendations for Vicinity’s casual mall leasing space short term leases for specific ‘kiosk’ areas within the malls. There’s also room to grow the business’ community of data experts and further enable employees to make sense of their own data.
“We’ve built a really strong centralised data team, but there’s definitely an opportunity for each individual department to take more ownership of their data and how it’s consumed,” said Coleman. “Additionally, if we look at where we’re at today, a lot of the models and dashboards we produce are focused on better understanding and managing our centres. In the future, we see an opportunity to leverage this IP to benefit our retail partners more directly.”