BlaBlaCar matches drivers with empty seats with members who need a ride. With 10 million travelers connected each quarter—that’s 40 million a year—BlaBlaCar estimates that it has saved its riders more than £216 million. The Data Team at BlaBlaCar wanted to give employees across the company access to real self-service business intelligence. To make this goal a reality, they chose the combination of Dataiku’s Data Science Studio for data prep in combination with Tableau for visual data analysis. They share completed visualizations through Tableau Server. With help from Tableau and DSS, BlaBlaCar can quickly track how members are responding to new features or support R&D efforts like Machine Learning.
Tableau: Who uses the combination of Tableau and Data Science Studio (DSS) at BlaBlaCar? Gaëlle Periat, BI Manager, BlaBlaCar: At BlaBlaCar, everyone uses Tableau or DSS. They have so many different uses: from approving a new feature, which means we're going to pull data from the application, to getting a visualization of: 'Does it work? Are people happy, etc.' And they can also result in analyses with a huge impact on marketing or completely, more on R&D, which means we're going to try to do some testing in an even deeper, more probing way, going as far as machine learning, etc." Thomas Cabrol, Chief Data Scientist, Daitaku: In terms of business use cases, there are all kinds of uses that are relevant for Blablacar with the combination of Data Science Studio + Tableau. The idea is that users can really manipulate and model their data in Data Science Studio, then visualize it, interact, and really analyze the data in Tableau.

Tableau: Why did your company decide to invest in a combination of Tableau with DSS? Gaëlle: The benefits that we can get thanks to the combination of DSS and Tableau will be pretty numerous and varied. We will be able to use it to improve the product. We can to use it to improve our user experience, because for us, our members are truly fundamental, and they’re going to be the main focus of our work, so we strive to help them to be more comfortable with our product. We will also be able to address some more marketing and business-focused points and benefits, as well as those more geared towards forecasting, etc.—which go somewhat hand in hand with the world of data and the way we organize ourselves these days. So there will be also a lot of future usages of the combo DSS and Tableau together that are coming up and will help us at BlaBlaCar.
We will be able to use [the Tableau and DSS solution] to improve the product. We can use it to improve our user experience, because for us, our members are truly fundamental, and they’re going to be the main focus of our work.
Tableau: What are some of the current use cases of Tableau and DDS solution? Gaëlle: There is all this phase of what these days is called Machine Learning, which is going to be more about forecasting and recommendations. And then, as I just said a few minutes ago, thanks to the DSS plugin with Tableau, we will be able to offer self-service BI. In other words, we will be able to provide users with data. Then it is up to them to prepare the data and then integrate them into Tableau to tell their stories and carry out their own analyses. Tableau: Why did you choose the combination of DSS and Tableau for your business intelligence solution? Gaëlle: So the idea is really to prepare the data via DSS and to use Tableau for visualization, so that we can tell stories or carry out deeper analyses which will help us manage our product and make decisions more easily. Thomas: The two solutions' technologies complement each other directly. As Gaëlle said, DSS's interactive 'data preparation' component is a real strength and in the end, it enables Tableau users, and a great many of them too, to consume data that have been cleaned up and enriched beforehand, and that are easier to use with Tableau so that everyone can derive maximum value from them.

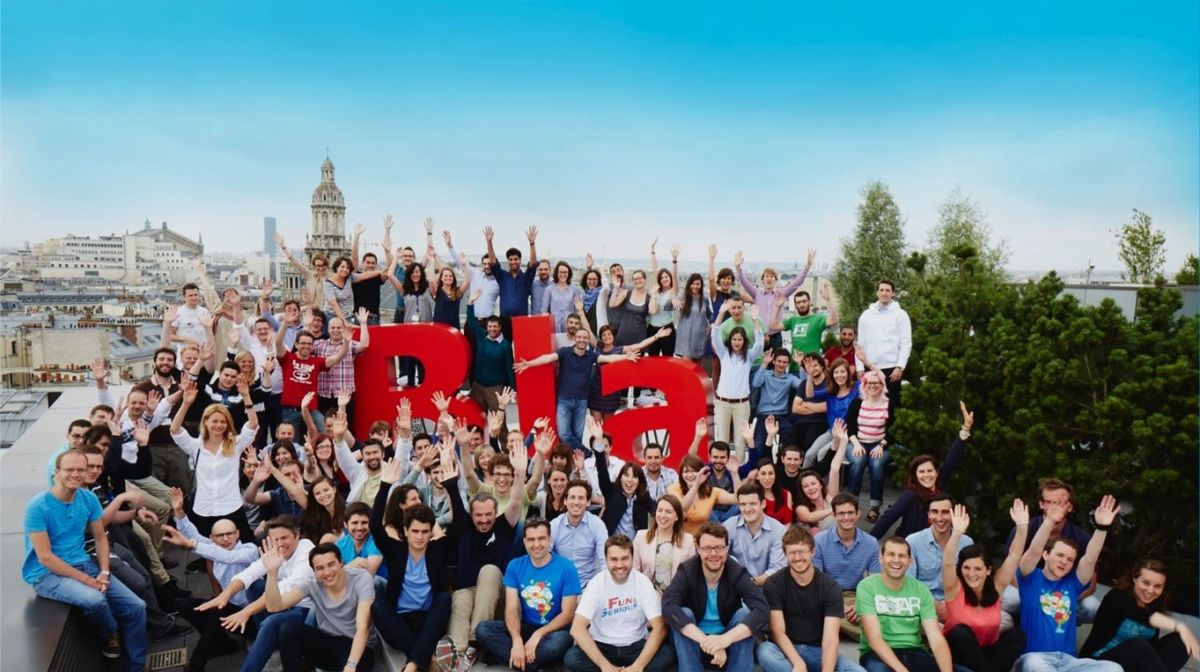
The BlaBlaCar team on the rooftop of their Paris headquarters.