Subject Area: Design
Level of complexity: Advanced
Approximate Time to complete: 30 minutes
Companion Workbook (twbx): ConditionalFormatting.twbx
Additional Resources on the web:
- http://kb.tableau.com/articles/howto/conditional-format-row-background-color
- http://community.tableau.com/ideas/2487
In Tableau, applying KPI conditional formatting across one measure is easy. In the screenshot below see a scorecard breakdown showing a conditional format based on profit for various products over various years.
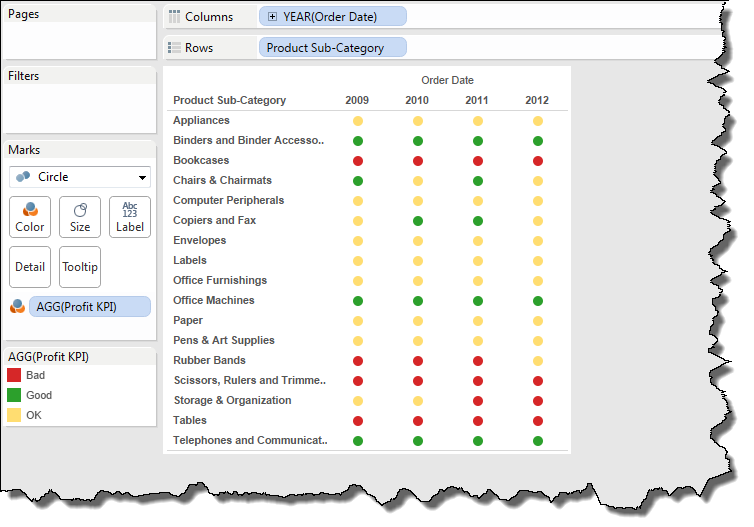
To achieve this view, the user simply needs to drag and drop the 3 data elements onto the respective columns, rows and color shelves. While this type of analysis is easy to achieve in Tableau, more robust conditional filters can be more complex to achieve. Users that come from using excel, where it is easy to conditionally format per each column or cell, find these scenarios harder to stumble across in Tableau.
However, similar conditional formatting can still be achieved in Tableau. Different than excel, conditional formatting in Tableau cannot be applied across a column but rather across a mark. Marks are generated when measures are added to the rows/columns shelf. Adding these additional marks allows a user to achieve a similar result to excel-like conditionally formatted crosstabs.
See below for the steps required to recreate.
First, create a view with the proper field listing row values. Next, instead of adding measures to the columns shelf, add number of records fields instead and set the aggregation to min so all the bars=1. If you plan to ultimately construct a crosstab with 2 measures then add 2 number of records fields.

Next, right click each of the respective axis' and set a fixed range from 0-1 so the bars fill what looks like an entire row (it is actually a bar).

Now that we have what looks like color-filled rows, we can start to customize the labeling and format of those rows to look just like a conditionally formatted crosstab in excel.
Add separate KPIs and data labels to the respective marks cards and you achieve the final result below.

This is how you can create robust conditionally formatted crosstabs in Tableau.