Best of Tableau Web: November 2022


Hello, Data Fam! This time of year always inspires a bit of nostalgia, looking back on past year and towards the year to come.
I had a healthy dose of nostalgia in November, when Pokémon Scarlet and Violet was released. And, like countless other 90’s kids, I played Pokémon on my Gameboy Color, fighting over holographic trading cards with my brother, and dressing up as Pikachu for Halloween. I’ve played nearly every mainstream Pokémon title since Red and Blue, and my latest rediscovery of catching em’ all led to another rediscovery—of the Tableau community project Games Night Viz, led by Will Sutton, Louis Yu, and Tina Covelli. I downloaded a Pokedex’s worth of data on every one of the 900 pocket monsters across 8 preceding generations of Pokémon, and as I was scrolling the #DataFam hashtag for inspiration, I came across some amazing visualizations from the #GamesNightViz family. I’m currently working on my own Games Night Viz, using data to support my firm belief that it’s always the best choice to choose the fire starter Pokémon (Team Fuecoco!).
The past few weeks have also held the annual release of Spotify Wrapped. As a data person, I wanted to dive even deeper into my data, so I’ll be following the instructions in this post to put together my own data-enriched year in review using my Spotify data. Maybe I’ll even create my own WDC or post it to #DataPlusMusic.
Finally, Giving Tuesday gave me an opportunity to think back on all of the deserving non-profits and NGOs I have had the privilege to work with as a Solution Engineer at Tableau. I am particularly proud of the team at ICAAD, who have done ground-breaking work connecting legal scholarship with data (and Tableau dashboards) to track gender bias and discrimination in judicial systems across the Pacific Islands. The project was so successful in narrowing bias gaps and improving outcomes that it is now rolling out to the Caribbean and 14 countries in the region. ICAAD is near and dear to me because they first reached out via Tableau Service Corps a years-and-a-half ago, and now I am lucky to be a part of their advisory board. That’s how powerful the #DataFam can be!
Wishing everyone in our DataFam a peaceful and healthy end of the year, spending time with loved ones.
Calculations
- How to Calculate Tenure in Tableau
Eric Parker, One Number
Data Culture, Blueprint
- 6 Tips to Develop and Enhance the Analytics Capabilities of Your Team
Alicia Bembenek, phData
Inspiration
- To Gauge or Not to Gauge
Dawn Harrington, Tech Tips Girl
- Gradient Chord Chart
Brian Moore, Do Mo(o)re with Data
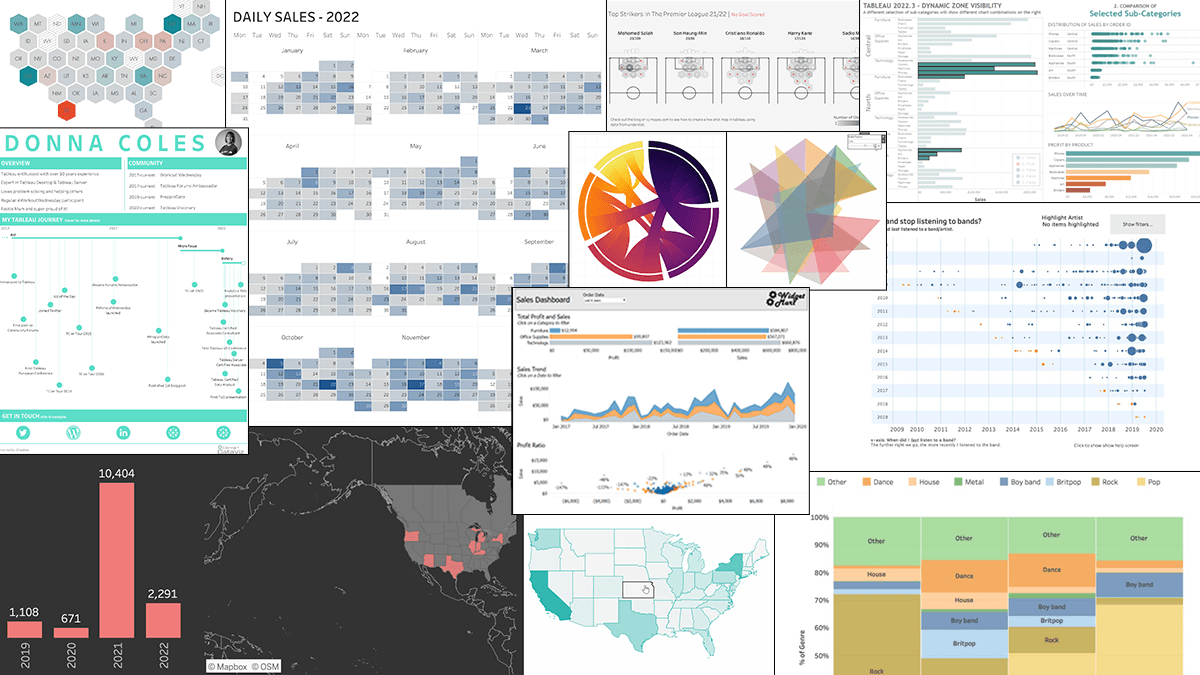
- Building My Tableau Journey
Donna Coles, Donna + DataViz
- How to Create a Full Year Calendar Heatmap in Tableau
Andy Kriebel, VizWiz
- Soccer Hex Shot Map
CJ Mayes
- What’s Good? Learning Is an Imperfect Process
CJ Mayes and Sean Miller
- Fun With Curves in Tableau Part 2+: Controlling Bezier Curves
Brian Moore, Do Mo(o)re with Data
- How I Passed the Tableau Certified Data Analyst Exam
Anthony Smoak, Smoak Signals
Formatting, Design, Storytelling
- Dynamic Zone Visibility Dashboard
Marc Reid, datavis.blog
- How to Do Better Sheet Swapping with Tableau’s Dynamic Zone Visibility
Ryan Sleeper, Playfair Data
- Spicy Tables - Freeze a Row & Compare All Other Rows
Autumn Battani, guest blog on The Flerlage Twins
- Customize How Your Map Looks in Tableau?
Shahid Sheikh, Vizartpandey
- Tell me a story! Helping people see the stories in business dashboards
Nicole Klassen
- How to Build Expandable Tables with Zone Visibility in Tableau
Luke Stanke, phData
Prep
- Writing your data to CRM Analytics (Salesforce) with Tableau Prep
Tim Dries, Biztory
Server
- Underutilized Tableau Features Part 3: Alerts
Brandi Beals
- What are my Viewers doing on Tableau Server?
Mark Bradbourne, Sons of Heirarchies
Set and Parameter Actions
- Tableau Set Control Part 2: Use Cases
Ken Flerlage, The Flerlage Twins
- Tableau Set Control Part 3: Use Cases (Continued)
Ken Flerlage, The Flerlage Twins
Title
- Dynamic Top N and % of Total
Dawn Harrington, Tech Tips Girl
- A Solution to the Hex Map Filtering Issue
Kevin Flerlage, The Flerlage Twins
Visualizations
View last month’s Viz of the Day on Tableau Public gallery.
Histórias relacionadas
DataFam Roundup July 2026

DataFam Roundup June 2026
