Todas as histórias de Visualizations
 Visualizations
Why scribbling is the key to truly understanding your data
 6 Dezembro, 2016
Scribbling is especially valuable when it comes to data analysis. Simply put, the goal of analyzing data is to find insights and communicate them in an optimal, engaging way. But you don’t reach this goal by first deciding which chart types you want and then adding the data. Saying something like “I will start with a bar chart” and adding data to it is the equivalent of trying to create a masterpiece with a paint-by-numbers set.
6 Dezembro, 2016
Scribbling is especially valuable when it comes to data analysis. Simply put, the goal of analyzing data is to find insights and communicate them in an optimal, engaging way. But you don’t reach this goal by first deciding which chart types you want and then adding the data. Saying something like “I will start with a bar chart” and adding data to it is the equivalent of trying to create a masterpiece with a paint-by-numbers set.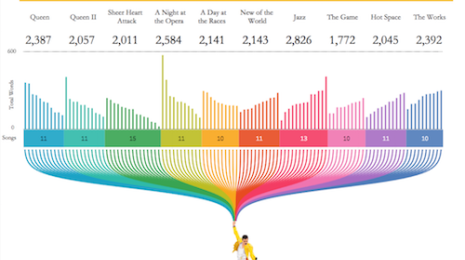 Visualizations
Resumo das visualizações: Músicas, feitiços e votos do colégio eleitoral
 28 Novembro, 2016
Da eleição presidencial dos EUA a feitiços de Harry Potter e à vida dos taxistas, vocês, nossa brilhante comunidade, criaram muitas visualizações excelentes que exploram uma variedade de tópicos nos últimos meses. Confira a seguir cinco destaques de nosso feed "Visualização do dia".
28 Novembro, 2016
Da eleição presidencial dos EUA a feitiços de Harry Potter e à vida dos taxistas, vocês, nossa brilhante comunidade, criaram muitas visualizações excelentes que exploram uma variedade de tópicos nos últimos meses. Confira a seguir cinco destaques de nosso feed "Visualização do dia". Visualizations
Quer encontrar as informações ocultas nos seus dados? Pergunte “por quê” quantas vezes for necessário
17 Novembro, 2016
Digamos que as vendas estejam fracas, os custos estejam altos e os recursos estejam sendo mal aproveitados. Quem nunca passou por isso? Ser capaz de identificar esses problemas é fácil. A parte difícil, porém crucial, é chegar à raiz do problema para que você possa tomar uma atitude. Como fazer isso? Pergunte-se “por quê” várias vezes.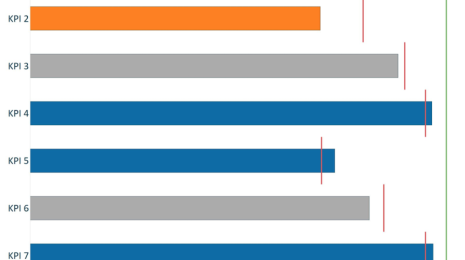 Visualizations
How to make pace charts in Tableau
Pace charts are an alternative bullet graph design that normalize progress to goal visualizations across KPIs, even if the KPIs have different data formats, scales, and/or seasonal trends. They are useful for providing an apples-to-apples, pace-to-goal comparison in businesses that have KPIs that span different categories such as revenue, social media followers, attendance, etc.
 Visualizations
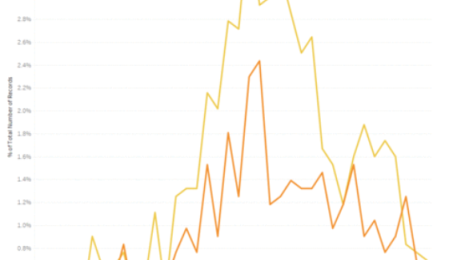
6 data-viz tips from election vizzes in the media
27 Outubro, 2016
Elections are exciting times for the data visualization and data journalism field. The innovations in each election cycle set the trend for the future of the field.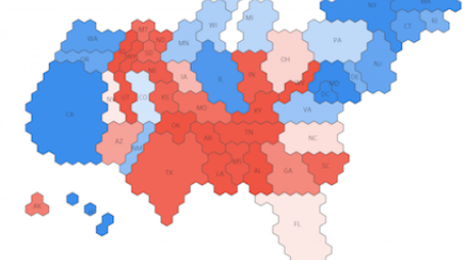 Visualizations
How to create an electoral-college cartogram in Tableau
A lot of my previous work has been centered around custom maps or mapping techniques within Tableau. I've always been fascinated with FiveThirtyEight's custom electoral-college cartogram used in its 2016 election forecast. This type of cartogram was created in response to critiques about the use of geographic maps to show election data. So here's how I did it in Tableau.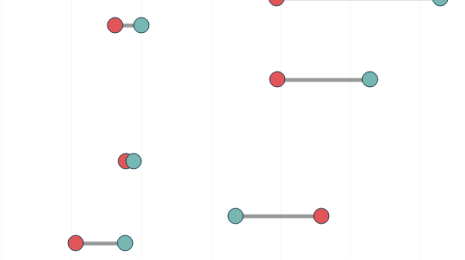 Visualizations
How to make dumbbell charts in Tableau
Tableau dumbbell charts, also known as DNA charts, are an alternative visualization choice for illustrating the change between two data points. Dumbbell charts get their slang name from their appearance, which look similar to weights, and sometimes strands of DNA, when they are in a horizontal orientation. Visualizations
Tableau tip: A shortcut for selecting layout containers
Years ago, one of my colleagues asked if you could eventually learn everything there was to ever know about Tableau. Naively, I said, “Yes.” But I was wrong! I learn Tableau every day.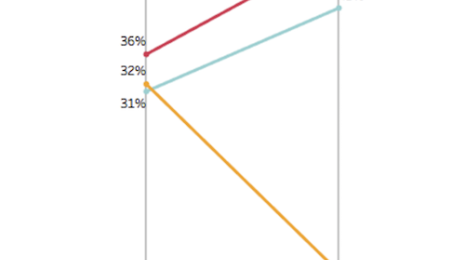 Visualizations
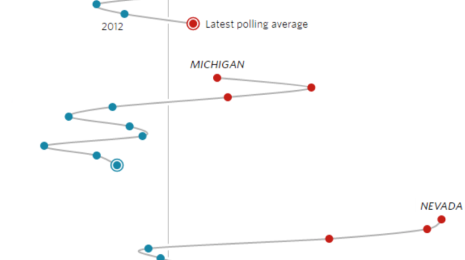
How to add vertical lines to slope graphs with multiple measures
Andy Kriebel recently posted a great tutorial on adding vertical lines to a slope graph using reference lines. This works great for slope graphs when you are comparing the same measure across dimensions, but what if you want to compare two measures across a dimension?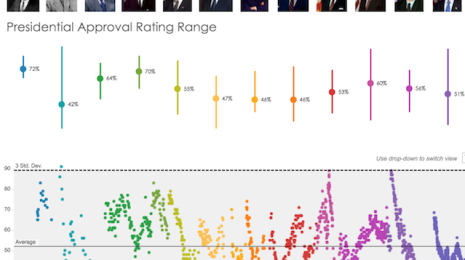 Visualizations
Election viz gallery: Exploring the data stories behind the races
You've heard from the candidates—but what does the data say? Join us as we explore the data stories behind the US elections. Visualizations
Seis visualizações que eu queria ter visto na faculdade
Só comecei a ficar empolgada em trabalhar com dados depois de me formar. Foi então que descobri como é incrível poder visualizar meus próprios dados. Fiquei encantada com a ideia de contar histórias visuais com dados que eram importantes de verdade para mim. Pela primeira vez, pude ver como os dados se aplicavam à minha vida! Quem me dera eu tivesse descoberto isso na faculdade. Isso me inspirou a compartilhar as seis visualizações de dados que eu gostaria de ter visto naquela época, quando eu ainda era uma estudante universitária. Visualizations
Lessons from photography: How to better visualize data
 12 Setembro, 2016
When I discovered Tableau at work, it was like the day I got my first digital camera. I had finally found a tool with which I could answer my customers’ questions faster than ever before! And I could also apply my passion for photography when designing dashboards.
12 Setembro, 2016
When I discovered Tableau at work, it was like the day I got my first digital camera. I had finally found a tool with which I could answer my customers’ questions faster than ever before! And I could also apply my passion for photography when designing dashboards.