Todas as histórias de
 Data
DataTableau Doctor: 1 Column, 2 Dates? Use Custom SQL
 30 Setembro, 2015
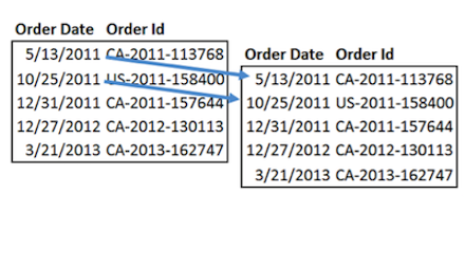
I am a huge fan of doing things the right way instead of using workarounds or shortcuts. Tableau is an incredible tool for solving problems, and using the functionality within Tableau, I have rarely found a problem unsolvable. That being said, sometimes it just makes more sense to make the data easier to work with before bringing it into Tableau.
30 Setembro, 2015
I am a huge fan of doing things the right way instead of using workarounds or shortcuts. Tableau is an incredible tool for solving problems, and using the functionality within Tableau, I have rarely found a problem unsolvable. That being said, sometimes it just makes more sense to make the data easier to work with before bringing it into Tableau. Visualizations
Check Out These Visual Analytics Features in Tableau 9.1
Tableau 9.1 lets you ask and answer more explicit questions of your data. Take advantage of these visual analytics features to dig deeper.
 Data
DataHow to Improve Your Data Skills & Become an Exceptional Human Being
 25 Setembro, 2015
Here’s proof that Tableau Zen Masters are much more than data viz whizzes. As part of our back-to-school series, we asked our Zen Masters to share tips for our community of data explorers. And what we got in return was a wealth of wisdom that range from data tips to life lessons. Here are their insights, which can benefit all of us—as data explorers and as human beings.
25 Setembro, 2015
Here’s proof that Tableau Zen Masters are much more than data viz whizzes. As part of our back-to-school series, we asked our Zen Masters to share tips for our community of data explorers. And what we got in return was a wealth of wisdom that range from data tips to life lessons. Here are their insights, which can benefit all of us—as data explorers and as human beings. Tableau Cloud
First comes agility, then competitive edge with cloud analytics
In its beginning days, cloud was seen as a cost-cutting tool. Now the top reason organizations embrace the cloud is business agility, according to a 2014 Forrester survey. Other factors like speed to deployment and lower costs now rank lower.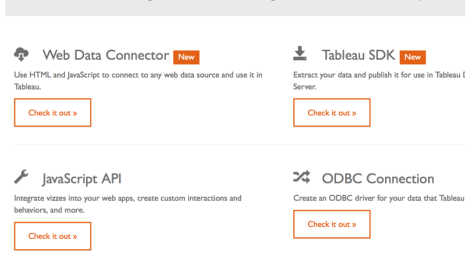 Product
Calling All Devs to the New Tableau Developer Portal
 22 Setembro, 2015
With the launch of Tableau 9.1, there are now four major areas of extensibility for developers to leverage to extend Tableau in new directions, automate tedious tasks, and connect to more data sources. We’ve also got a new home for developers to get everything they need.
22 Setembro, 2015
With the launch of Tableau 9.1, there are now four major areas of extensibility for developers to leverage to extend Tableau in new directions, automate tedious tasks, and connect to more data sources. We’ve also got a new home for developers to get everything they need. Tableau Public
Lessons from the Inaugural Class of The Information Lab's Data School
18 Setembro, 2015 Visualizations
Protip for students: 5 steps to creating A+ data visualizations
 16 Setembro, 2015
An effective data visualization lets users see and understand the data at the speed of thought. You can visualize data from biology labs, accounting case studies, or any other subject you’re studying to find answers faster. Here are five ways to improve the overall value of your dashboards.
16 Setembro, 2015
An effective data visualization lets users see and understand the data at the speed of thought. You can visualize data from biology labs, accounting case studies, or any other subject you’re studying to find answers faster. Here are five ways to improve the overall value of your dashboards. Tableau Public
Aging, Immigration, and Retirement: Understanding Demographic Changes with Tableau Public
16 Setembro, 2015
 Visualizations
Tableau on Tableau: How we design our Salesforce dashboards
 14 Setembro, 2015
A dashboard is only effective if it answers useful questions for people. That’s why a customized, user-specific dashboard is more impactful than a ready-made, one-size-fit-all report. Here at Tableau, we always design visualizations with the user in mind. Here are several techniques we use to customize our sales dashboards.
14 Setembro, 2015
A dashboard is only effective if it answers useful questions for people. That’s why a customized, user-specific dashboard is more impactful than a ready-made, one-size-fit-all report. Here at Tableau, we always design visualizations with the user in mind. Here are several techniques we use to customize our sales dashboards.