October 9, 2013
5 business lessons I learned at the Tableau Customer Conference
It’s now a month since we held our Tableau Customer Conference in Washington DC. I wanted to take some time to reflect and share 5 lessons I learned from the sessions I attended. It's never easy choosing what to go and see, but every session will teach you something new. I'm also delighted to be able to share the session recordings so you can watch the sessions for yourself. If you like what you see - don't forget you can register NOW for the September 2014 Customer Conference in Seattle.


It’s now a month since we held our Tableau Customer Conference in Washington DC. I wanted to take some time to reflect and share 5 lessons I learned from the sessions I attended. It's never easy choosing what to go and see, but every session will teach you something new. I'm also delighted to be able to share the session recordings so you can watch the sessions for yourself. If you like what you see - don't forget you can register NOW for the September 2014 Customer Conference in Seattle.
Why you need to make your audience go “Wow” (and how to do it)
Jon Schwabish (@jschwabish), economist at the Congressional Budget Office, discussed the purpose of data visualisation and how you can make a greater impact with your work. He explained the importance of making your audience go “Wow!” There are two reasons you want them to do this. First, you want them to lean IN and engage with your data. Second, you want them to also lean OUT as a result of the impact of a well-designed, attention grabbing visualisation. He presented a foundation for designing effective visualisations.
Check out our whitepapers on Data Visualisation
You can be enterprise ready very quickly
Michael Drollinger and Amy Song from Sea-Tac airport explained how it is possible to roll out Tableau across the enterprise in just 6 months. To achieve this, they needed executive level sponsorship, a fantastic IT team, and to map BI to the organisation’s strategic goals.
Rolling out across the enterprise needs more than just support from senior staff. It is important to generate a self-sustaining centre of excellence too. At Sea-Tac they have regular internal user groups where they share success stories, tips & tricks and challenges. As a result, they have now improved many areas of the airport, including luggage management and their car parks. They also monitor their server by accessing the Tableau Repository.
Watch a video showing IT's perspective on Tableau Find out more about User Groups
You can find complex geographical relationships, easily
Redbox, specialising in DVD rentals via its network of kiosks across the US, shared how they use Tableau’s maps to decide where to locate new kiosks. Their analysis has revealed unexpected relationships between kiosks. They had assumed that kiosks located close to each other would cannibalise sales. However, their mapping analytics in Tableau revealed that in many cases 2 kiosks on opposite sides of a street might not cannibalise sales at all. The type of store where the kiosk is located is a stronger indicator than the closeness of kiosks.
Whitepaper: Maps: The Power of "Where"
Tableau can simplify your BI
The FAA, like many organisations, had a data problem. Data was in siloes, not shared, and difficult to reach. There was an opportunity to bring IT systems together, further encouraged by the need to cut costs across the organisation. They are rolling out a unified enterprise-wide platform to provide authoritative, trusted FAA information. This platform will be the basis for decision making in the FAA. Tableau is a key part of that, providing all employees with the ability to explore and analyse data.
Staff are no longer just data gatherers, they are fully fledged data workers. This has increased engagement and buy-in across the organisation.
BI Requirements for IT: What every IT Manager Should Know
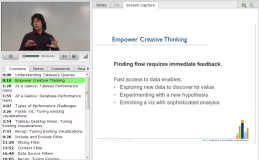
Performance enables creativity
Robert Morton, senior software engineer at Tableau, gave a great presentation on how to optimize Tableau connections and workbooks. By ensuring your analytics are fast, you spend more time being creative: exploring, analysing, seeing you data. Once you can query your data at the speed of thought, the technology melts into the background. This session was excellent for practical applications of Tableau. Being a geeky kind of guy, he even used super-cool technology to record his session!
Watch Robert's session about optimizing query performance
Watch Robert's session about optimizing query performance
Conclusion
Choosing sessions at a Tableau Customer Conference is never easy. The great news is that you could choose any random session to go to and be sure to come away with information you can use to improve your own work with Tableau. We've already opened up registration for next year's conference and right now there is a huge $400 discount. Head on over to the site and register now:
Register for the 2014 Tableau Customer Conference