Quickly explore opportunities and optimize costs
Any analytics application can create a stock price and volume chart. But how do you use data to drive down trading costs, reduce portfolio risk, discover anomalous trades, and look for opportunities? Tableau supports these goals by letting you pan and zoom through large volumes of data, filter to areas you’re interested in, and drill into the underlying trading history. Imagine calculating compound returns and regressions with a click, and seeing visual results instantly.
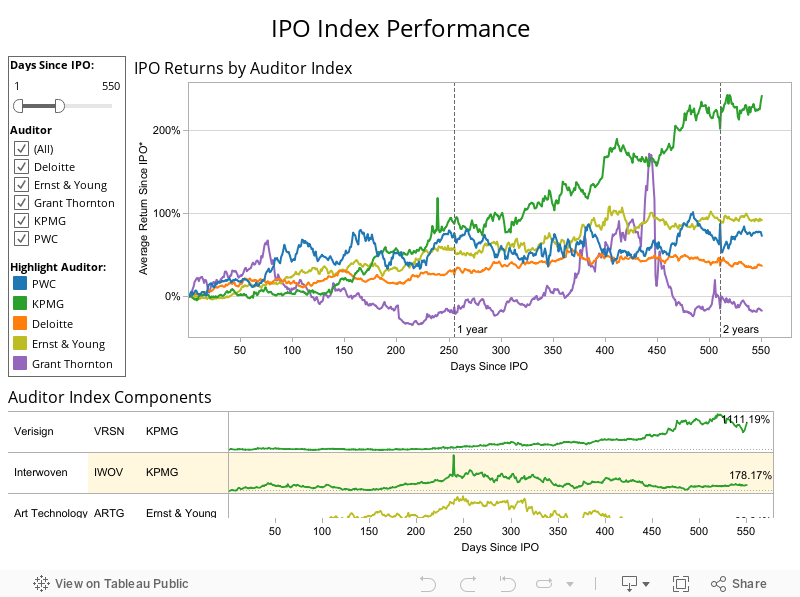
This dashboard lets you explore the performance of a basket of technology IPOs. The indexes are based on company auditor. Select an index in the upper visualization and see the companies that comprise them in the bottom visualization. Use the application to compare the performance of different indexes over different periods.
For instance, adjust the filters to see whether the PWC or KPMG index offered the best returns during the first 300 days after IPO. As you investigate, you’ll notice that the top performing indexes were reliant on a few super star companies. This dashboard was created with Tableau’s drag and drop interface in minutes.