Analyze donation trends
It is mission critical for not-for-profits to have insights to their fundraising campaigns, including where their donors are geographically located,the demographics of their donors, and when they are donating. This information collectively unearths the answers to the questions fundraising organizations face each day: who are my donors, when will they donate, how much will they donate, and which factors influence their donation frequency and amount.
With Tableau Desktop, you can easily combine all of your collected data about your donors with public demographic data and overlay the rich data sets on top of Tableau’s map to visualize and analyze these details for insights.
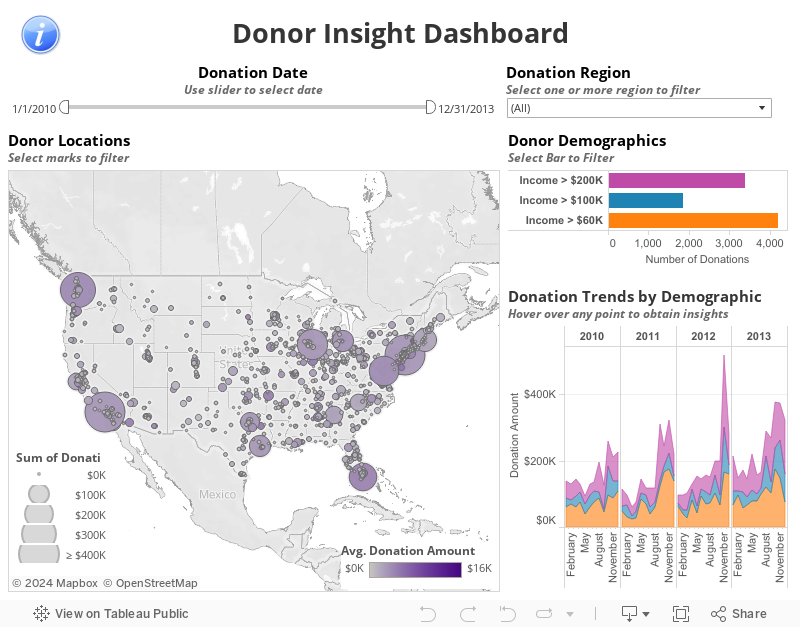
With the Donation Insight Dashboard, you can obtain a wealth of information about who your donors are, where they live, and when and how much they have donated for any given period of the year. This dashboard illustrates a very important piece of information about how much and when during the year donors more are likely to donate.
Start with a map of the US you filter your donors by donation date, by region, or by donor demographics. Now you can analyze your data and make decisions. Not-for-profit organizations can now be more effective with their limited marketing funds. They can tailor their marketing campaigns, messaging, target certain demographics, and by regions and month to be more effective with their fundraising efforts.