
Telehealth and Tableau help Community Medical Centers withstand operational and budgetary challenges during COVID-19
Community Medical Centers (CMC) is a network of 22 neighborhood health centers based in Stockton, California. Started as a volunteer effort in the 1960s to serve agricultural workers, it has grown into a thriving nonprofit providing vital care to men, women, and children, regardless of ability to pay. CMC offers a wide range of services, including medical care, health outreach and education, behavioral health services, dental care, and HIV early intervention. Last year, CMC served over 100,000 patients across three counties and continues to grow.
In 2017, CMC had very limited capabilities for analyzing their data and presenting insights—or even the raw data itself—to the users who needed it. Developing solutions on their existing SQL Server Reporting Services platform took too long for each project to achieve real value, leading to a backlog of analytics requests and many challenges for delivering timely executive reporting. After searching the market for visualization tools, CMC landed on Tableau, which had a pricing model and on-premises option that fit well with the health center's needs. To date, CMC has built more than 70 Tableau dashboards and conducted in-house orientation classes that have helped Tableau adoption reach leadership teams and other personnel in all of their facilities.
The onset of the COVID-19 pandemic has made this access to analytics more vital than ever before, in part because of the increased reliance on telehealth visits. As a community health center, CMC relies heavily on in-person patient visits to sustain its operating budget. But the coronavirus crisis drastically reduced CMC’s number of in-person visits, threatening to decimate the organization’s operating budget. But this year, the virus threatened to decimate those revenues due to the risks of seeing and treating patients face-to-face. In April 2020, the National Association of Community Health Centers projected 34 million fewer in-person visits in the community health subsector over six months, resulting in $7.6 billion in lost revenue and more than 100,000 lost jobs. California was the U.S. state predicted to lose the most revenue by far, with more than twice the projected losses of the second state on the list, New York.
With the financial impact from COVID-19 on our organization, our Tableau dashboards gave us information on whether the change to telehealth was working and a way to see what our future could look like.
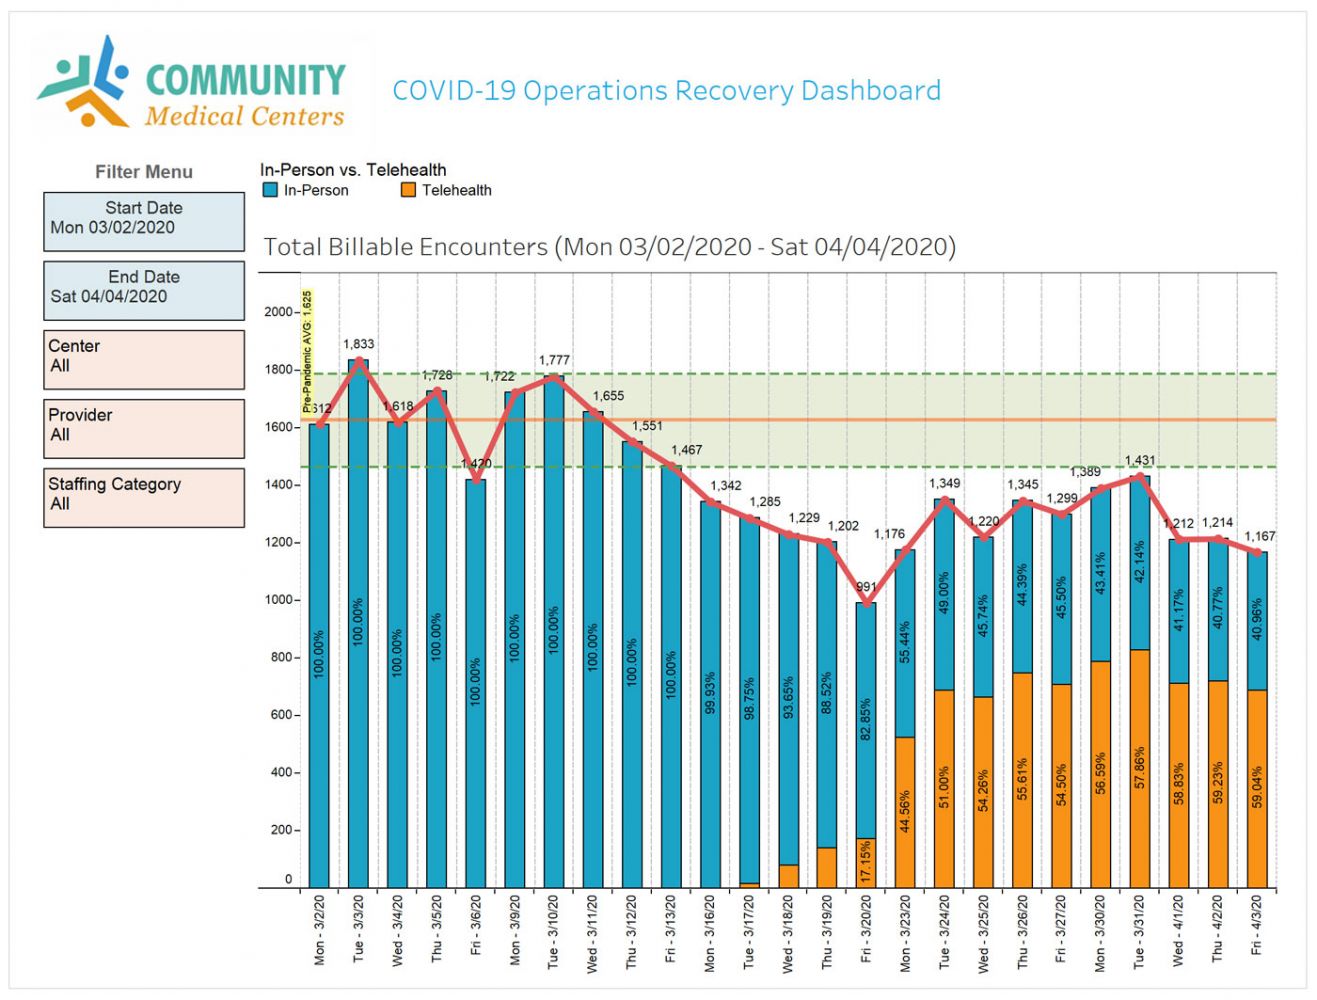
Before COVID-19, telehealth visits were not offered at CMC. But with the pandemic threatening the livelihood of the medical center, CMC was able to quickly pivot to offer most visits virtually in order to protect both staff and patients. The analytics team immediately created new Tableau dashboards to track the progress of this telehealth change. CEO Christine Noguera and her leadership team are now using these daily reports to understand the direction the organization is going and to share progress across the organization.
Using information from new COVID-19 Tableau dashboards, CMC clinicians conduct virtual patient sessions to provide care, advice, intervention, and monitoring, on both virus-related and non-virus cases. Data analytics supported every step of the process, providing holistic views of patient data as well as a risk stratification protocol for determining which patients had priority to visit a facility for further care. Telehealth capabilities not only helped financially by allowing for billable consultations throughout the statewide shutdown, but also helped CMC optimize care delivery and build trust in the community by assuring patients that their health centers were open for the most necessary services.
Other advantages of using data visualization at CMC during COVID-19 include:
- Ability to track results and spread of the virus based on many patient demographics such as age, previous diagnosis and location.
- Reliable tracking of test results and monitoring turnaround times for results coming back from labs.
- Easy dissemination of new operational guidance, such as which lab codes to apply for COVID-related procedures.
CMC also regularly participates in analytics or technology user groups and coalitions, and many of the organizations they collaborate with also use Tableau or are interested in seeing their analytics in Tableau.
By uniting around the shared challenges they face, these groups can use the common medium of visual analytics to learn from each other and grow stronger together. In this way, data plays a pivotal role in sustaining healthy, tight-knit communities at multiple levels: improving the efficacy of care teams and administrators at CMC, reinforcing their affiliation with other community health centers, and supporting better health outcomes for the central California populations they serve.
When the crisis began, we rapidly shifted the majority of our visits to telehealth visits. Tableau has enabled us to analyze and understand our rapidly changing landscape.