DataFam Roundup: July 4-8, 2022


Welcome! Dig into this week's DataFam Roundup—a weekly blog that brings together community content all in one post. As always, we invite you to send us your content—and the DataFam content from your peers that have inspired you! Find the content submission form here.
DataFam content
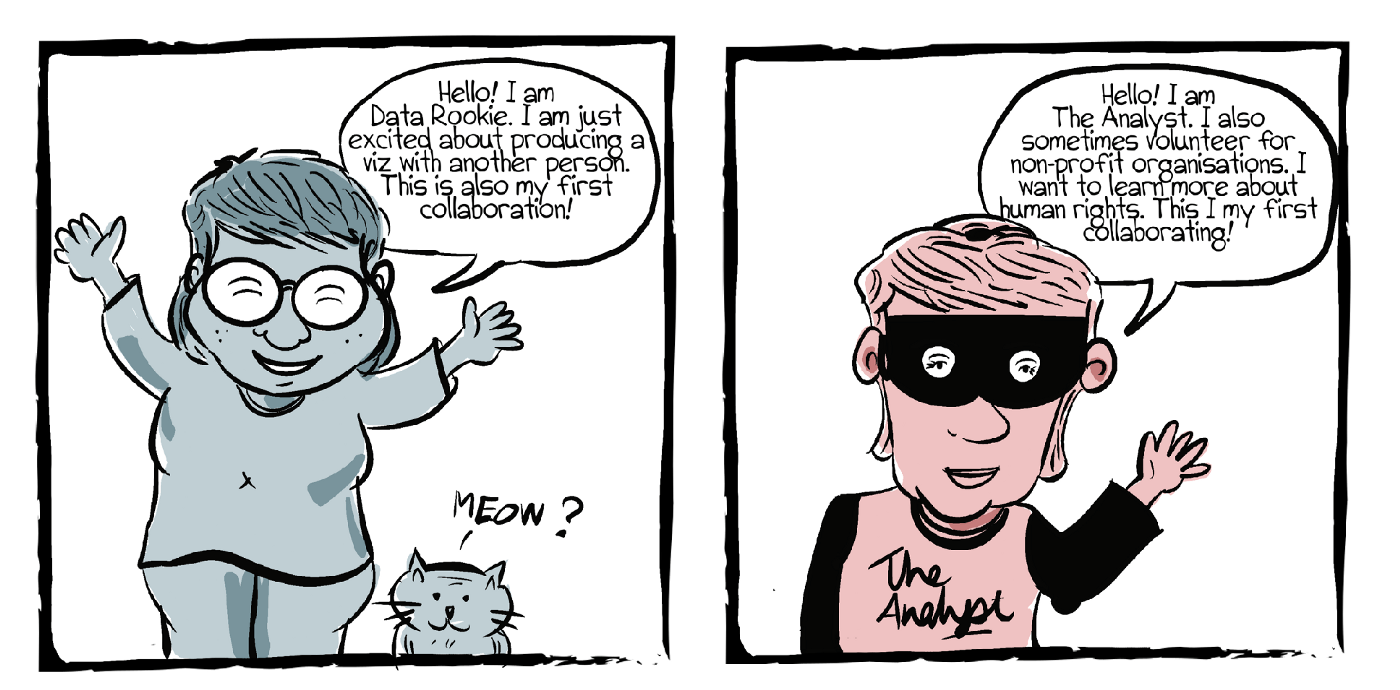
Shazeera Ahmad Zawawi, Chronicles of a Data Rookie: Building connections with data!
Dive into content created by the Tableau Community:
- CJ Mayes: What’s Good? Developing Skills Through Having Fun – Adam Green. (July)
- Alisha Dhillon: How to Learn and Get Started with Tableau
- Kevin Flerlage, The Flerlage Twins: Create a Random Starting Point on Tableau Public
- Jade Wimpey, Data Unjaded: Not Quite an IronViz Finalist
-
Mark Tossel, Salesforce 360 Blog: Building Your Salesforce Career Path? Here Are 7 Tips for Your Journey!
-
Andy Kriebel: How to Create a Hexbin Map in Tableau
-
Shazeera Ahmad Zawawi, Chronicles of a Data Rookie: Building connections with data!
-
Jim Dehner: Parameter How Tos
-
Ethan Lang and Maggy Muellner: How to remove padding from containers and sheets
-
Kim Tricker: A workaround to display relevant values only in a parameter drop-down in Tableau
-
Merav Yuravlivker: Three Ways Data Leaders Can Drive Impact Now
-
Mark Tossell, Salesforce Architects: Architecting for Analytics
Team Tableau
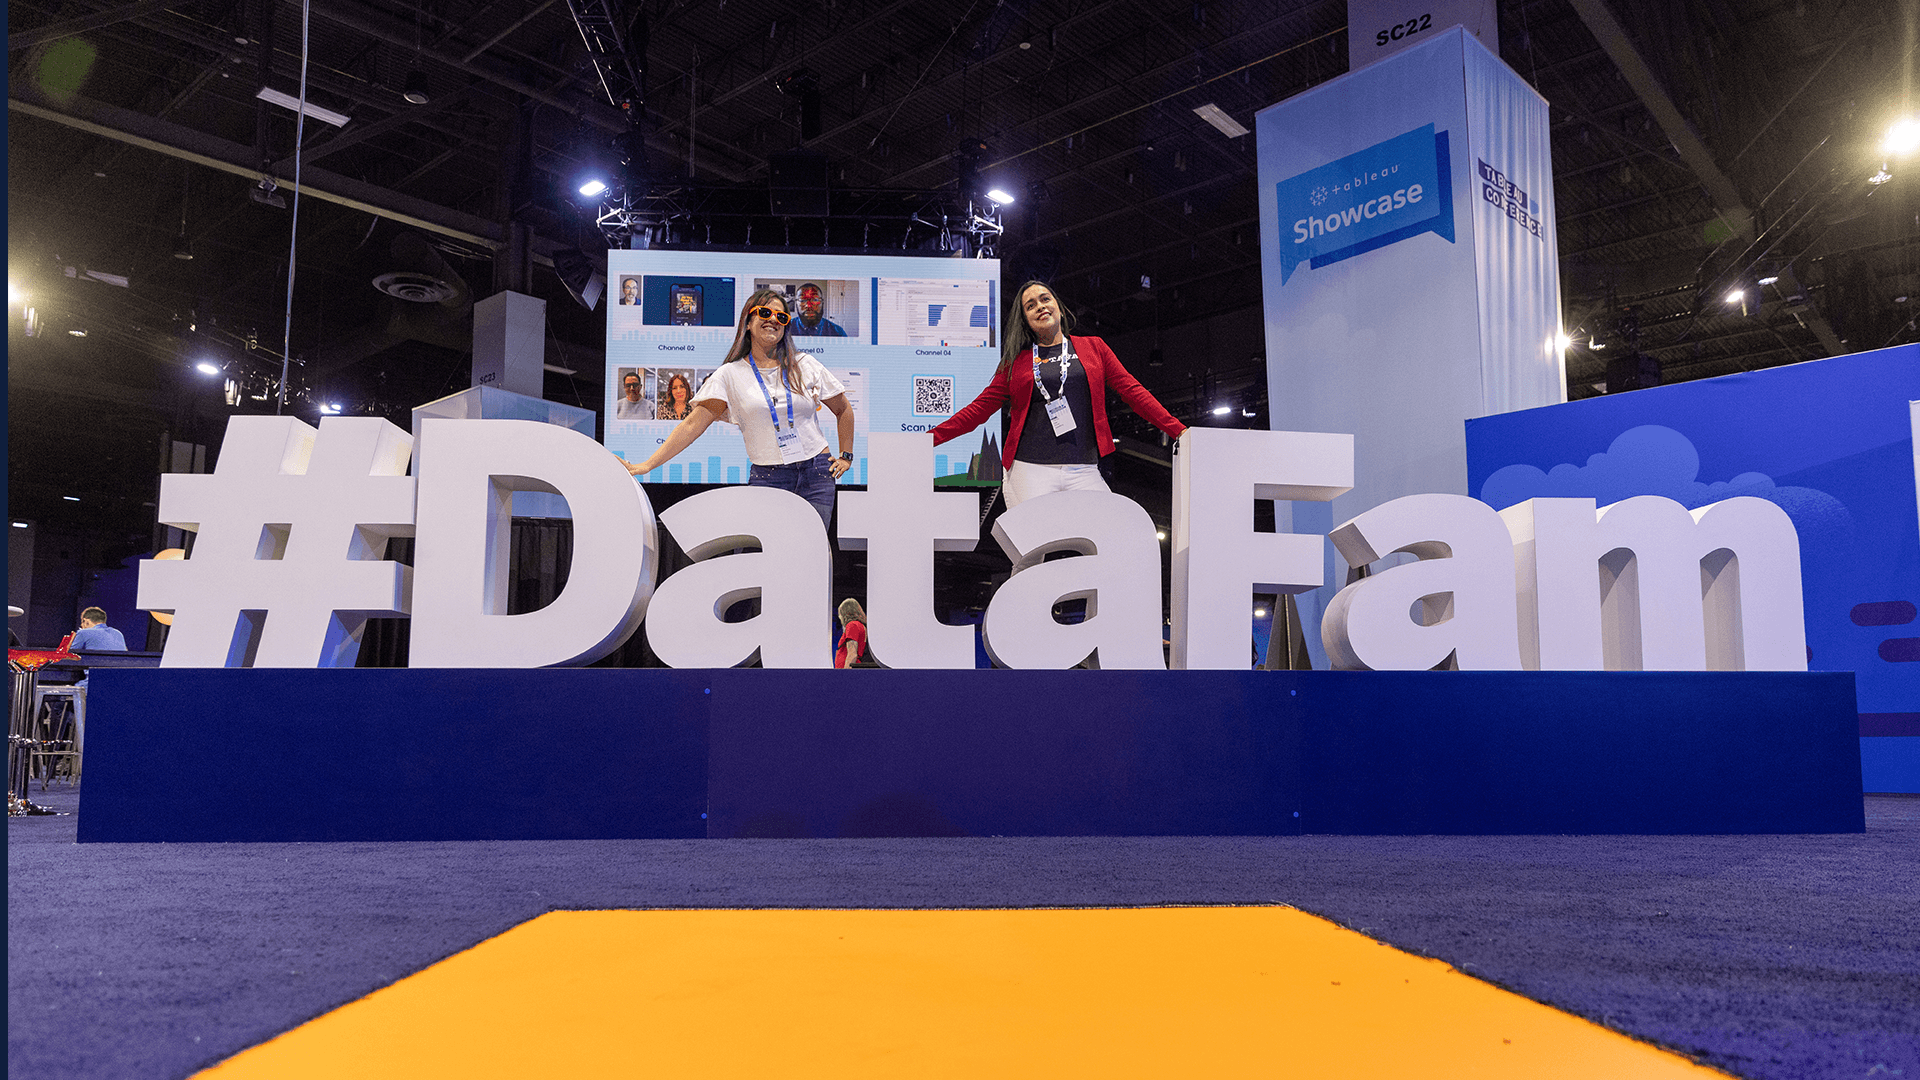
DataFam signage photo at Tableau Conference 2022
- 2022 Tableau Ambassador nominations and applications now open
- 5 Tableau Conference takeaways from the community
- CRM Analytics in 2 minutes with CRM Analytics Ambassador Preena Johansen
- How the Tableau Community Supported my data viz career with Tableau Public Ambassador Priyanka Dobhal
-
Staying motivated and inspiring others as a community leader with Tableau User Groups Ambassador Sebastián Soto
-
Why data skills get students noticed with Tableau Student Ambassador Vanessa Lam
-
The magic behind Tableau's Developer Program with Tableau DataDev Ambassador Robert Crocker
-
Community and pivoting into a career in data with Tableau Social Ambassador Alice McKnight
-
Hosting a community event? Here are three steps for success with Tableau User Group Ambassador Yamil Medina
-
My path to finding a career in data analytics with Tableau Student Ambassador Damola Agboola
Upcoming events and community participation
-
VizConnect Tableau Prep Academy: 4 weeks structured program to help you understand foundational knowledge of Tableau prep, Data structure , Data Densification, best practices and Tips & tricks.
- Tableau DataFest 2022: It’s time to sharpen your Tableau skills, propel your career forward, and have some fun at a Tableau DataFest in a city near you. Drawing together key sessions from Tableau Conference ‘22 in Vegas with new bespoke demos and deep dives from local customers and partners, Tableau DataFest is your destination for data.
- Stay up to date with the latest and greatest from the Tableau Community. We'll help you along in your Tableau journey, bring your data skills to the next level, and nurture powerful connections.
- Sign up to be a panelist for the 3charts@3 Live: A Mystery Chart Show featuring topics like personal finance, energy, healthcare and more!
- Data Book Club, Summer 2022 Selection: Invisible Women: Data Bias in a World Designed for Men
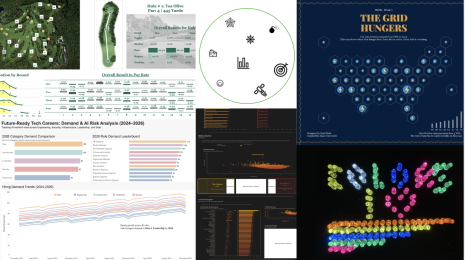
Vizzes
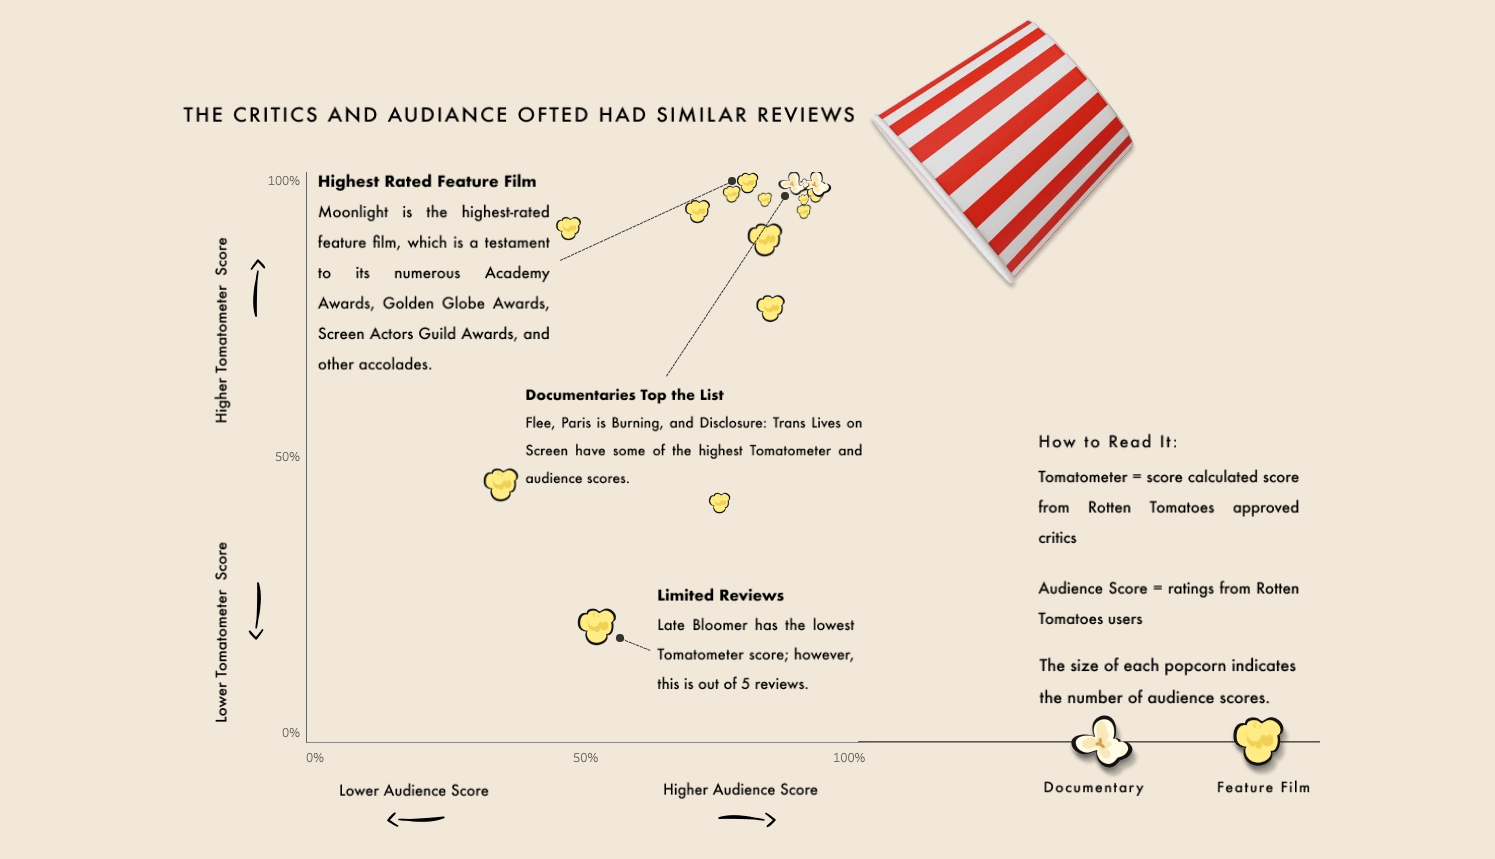
Adedamola (Damola) Ladipo: 16 Must-Watch LGBTQ Movies
See the latest Viz of the Day, trending vizzes, featured authors, and more on Tableau Public.
Check out some inspirational vizzes created by the community:
- Adedamola (Damola) Ladipo: 16 Must-Watch LGBTQ Movies
- Muhammad Azhar: Gender Pay Gap | UK
- Ghafar Shah: TikTok App Reviews | NLP Analysis
Community Projects
Back 2 Viz Basics
A bi-weekly project helping those who are newer in the community and just starting out with Tableau. Not limited just to newbies!
Web: Back 2 Viz Basics
Twitter: #B2VB
Week 13: Create a Symbol Map
Workout Wednesday
Build your skills with a weekly challenge to re-create an interactive data visualization.
Web: Workout Wednesday
Twitter: #WOW2022
Week 26: Let’s make a dynamic relative filter
Preppin' Data
A weekly challenge to help you learn to prepare data and use Tableau Prep.
Web: Preppin’ Data
Twitter: #PreppinData
Week 27: C&BSCo Clean and Aggregate
DataFam Con
A monthly challenge covering pop culture and fandoms.
Web: DataFam Con
Twitter: #DataFamCon
June 2022: Hugo and Nebula Awards!
EduVizzers
A monthly project connecting real education data with real people.
Web: Eduvizzers
July 2022: Global School-Age Digital Connectivity
Games Night Viz
A monthly project focusing on using data from your favorite games.Web: Games Nights Viz
Twitter: #GamesNightViz
July 2022: Nostalgic Games
Iron Quest
Practice data sourcing, preparation, and visualization skills in a themed monthly challenge.
Web: Iron Quest
Twitter: #IronQuest
July 2022: Nostalgic Games
Data Plus Music
A monthly project visualizing the data behind the music we love!
Web: Data Plus Music
Twitter: #DataPlusMusic
February 2022: MIDI Music Analysis
Storytelling with Data
Practice data visualization and storytelling skills by participating in monthly challenges and exercises.
Web: Storytelling with Data
Twitter: #SWDChallenge
July 2022: think globally
Project Health Viz
Uncover new stories by visualizing healthcare data sets provided each month.
Web: Project Health Viz
Twitter: #ProjectHealthViz
July 2022: Rural Hospital Closures (updated data)
Diversity in Data
An initiative centered around diversity, equity & awareness by visualizing provided datasets each month.
Web: Diversity in Data
Twitter: #DiversityinData
June and July 2022: Movie casting
Sports Viz Sunday
Create and share data visualizations using rich, sports-themed data sets in a monthly challenge.
Web: Sports Viz Sunday
Twitter: #SportsVizSunday
July 2022: 150th Open Championship
Viz for Social Good
Volunteer to design data visualizations that help nonprofits harness the power of data for social change.
Web: Viz for Social Good
Twitter: #VizforSocialGood
June 10-July 15: Bridges to Prosperity
Real World Fake Data
Create business dashboards using provided data sets for various industries and departments.
Web: Real World Fake Data
Twitter: #RWFD
Session 2: Financial Overview
Viz 2 Educate
Each month, create vizzes on global education syllabus topics as resources for teachers worldwide.
Web: Viz 2 Educate
Twitter: #Viz2educate
Makeover Monday
Join the community every Monday to work with a given data set and create better, more effective visualizations.
Web: Makeover Monday
Twitter: #MakeoverMonday
SDG Viz Project
Visualize data about Sustainable Development Goals provided by the World Health Organization.
Web: SDG Viz Project
Twitter: #TheSDGVizProject
관련 스토리

DataFam Roundup June 2026

DataFam Roundup May 2026