모든 스토리
 Product
Tableau 10.1 beta is here
 2016/08/31
Hot on the heels of Tableau 10, we are excited to launch the Tableau 10.1 beta! Tableau 10.1 includes new connectors and improved visual analytics capabilities to help you analyze your data even faster. For the enterprise, we’ve added big extensibility enhancements and more tools for server admins.
2016/08/31
Hot on the heels of Tableau 10, we are excited to launch the Tableau 10.1 beta! Tableau 10.1 includes new connectors and improved visual analytics capabilities to help you analyze your data even faster. For the enterprise, we’ve added big extensibility enhancements and more tools for server admins.
 Partners
Bringing the power of natural language to Tableau
 2016/08/30
Our new developer APIs are not quite as obvious as some Tableau 10 features, but they enable some pretty cool product integrations that we think you’ll like! In this post, I’m going to talk about an integration that enables something called natural language generation (NLG) which can extend the impact of your Tableau visualizations.
2016/08/30
Our new developer APIs are not quite as obvious as some Tableau 10 features, but they enable some pretty cool product integrations that we think you’ll like! In this post, I’m going to talk about an integration that enables something called natural language generation (NLG) which can extend the impact of your Tableau visualizations. Tableau Community
Roundup: Your Tableau TEN-ured stories and #Tableau10 moments
 2016/08/29
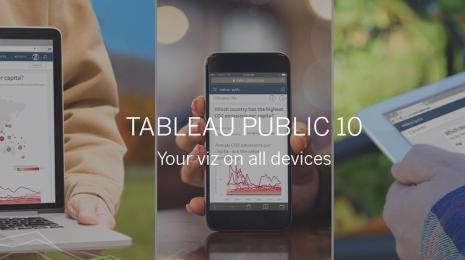
The release of Tableau 10 was the most community-driven release in Tableau history. From the Tableau 10 Virtual User Group to the Tableau Torch Relay, to Tableau 10 Live, you, our amazing community, have been with us every step of the way. When Tableau 10 launched, we asked you to share the stories of your own Tableau journey. Here are some of your stories and #Tableau10 moments as curated by Tableau Social Media Ambassadors.
2016/08/29
The release of Tableau 10 was the most community-driven release in Tableau history. From the Tableau 10 Virtual User Group to the Tableau Torch Relay, to Tableau 10 Live, you, our amazing community, have been with us every step of the way. When Tableau 10 launched, we asked you to share the stories of your own Tableau journey. Here are some of your stories and #Tableau10 moments as curated by Tableau Social Media Ambassadors. Tableau Community
And that’s a wrap for the Tableau Torch!
 2016/08/26
The Tableau Torch Relay has come to a close, and man, what a journey it was! From Seattle to New York and across the Atlantic, the torch made 10 stops in all, and ended its journey with a wrap party in London. And three of the torchbearers were there to celebrate with the London Tableau community.
2016/08/26
The Tableau Torch Relay has come to a close, and man, what a journey it was! From Seattle to New York and across the Atlantic, the torch made 10 stops in all, and ended its journey with a wrap party in London. And three of the torchbearers were there to celebrate with the London Tableau community.
 Visualizations
How to add context to Marimekko charts in Tableau
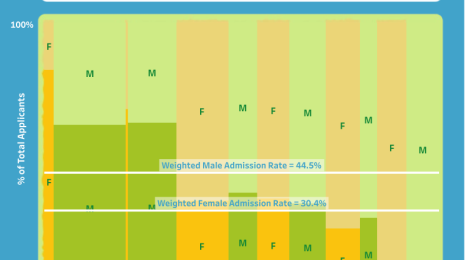
Throughout this series, we've been exploring admission rates at the University of California in Berkeley. In 1973, the overall graduate-school admission rates for men and women appeared to be biased toward men. But when looked at in more detail, the trend shifted the other direction. In four of the six largest departments, there were proportionately more women admitted than men.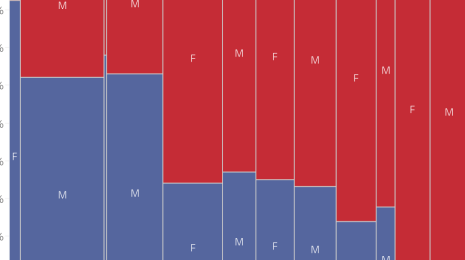 Visualizations
Tableau에서 Marimekko 차트를 작성하는 방법
Marimekko 차트가 무엇이며 어떤 경우에 가장 유용한지 안다면, 이제 Tableau에서 이 차트를 작성하는 방법을 알아볼 차례입니다.
 Tableau Public
Web Scraping for Everybody: Using the Import Functions in Google Sheets with Tableau Public 10
 2016/08/23
 Visualizations
An introduction to Marimekko, a chart of many colors and many names
A Marimekko chart is a two-dimensional stacked chart of stacked, contiguous bars—looking somewhat like a Marimekko fabric. Marimekko charts combine visual pop with information—the eye captures two levels of information as it admires the colorful pattern the chart creates. Tableau
Tableau appoints new CEO
 2016/08/22
We’ve decided it’s time to broaden our leadership team. I’m thrilled to share Adam Selipsky will join Tableau as our new CEO. Adam has spent more than a decade building Amazon Web Services from its inception. He’s been part of the leadership team that established AWS as the indisputable market leader in cloud platforms. Adam will start his new role on September 16, and we’re excited to further our mission under his leadership.
2016/08/22
We’ve decided it’s time to broaden our leadership team. I’m thrilled to share Adam Selipsky will join Tableau as our new CEO. Adam has spent more than a decade building Amazon Web Services from its inception. He’s been part of the leadership team that established AWS as the indisputable market leader in cloud platforms. Adam will start his new role on September 16, and we’re excited to further our mission under his leadership.