Viz in Tooltip is here!


Update: Tableau 10.5 is here! Download it now to try out the feature outlined below, including our blazingly fast new data engine technology Hyper.
In our upcoming Tableau 10.5 release, we’re proud to deliver on our promise of hosting incredible visualizations in tooltips. Not only is this feature an engaging form of viz interactivity, it’s also a fantastic way to augment your dashboards and stories with relevant data without introducing more clutter.
Viz in Tooltip allows you to place visualizations of your own design into tooltips, revealing them on hover or selection of individual marks. The data in the viz is automatically filtered to the mark you hover on or select, giving you and your users precise views of the pertinent data.
As some of the examples below will show, viz in tooltip is a great way to show a different level of detail, trends over time, or a legend for the main viz.
Getting started
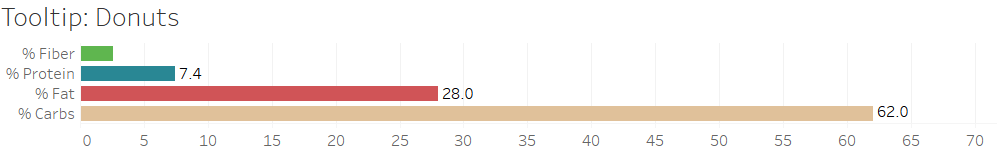
To get started, simply design a viz in a separate sheet that’s intended to go into the tooltip and then associate it with a host sheet through the Edit Tooltip dialog. For example, to make what you see above, I first designed the viz that will be my tooltip - a set of horizontal bars breaking down the nutritional values of various donuts:
Then, in my main sheet filled with sugary goodness, I used the Edit Tooltip dialog to Insert the Sheet I created into the tooltip:
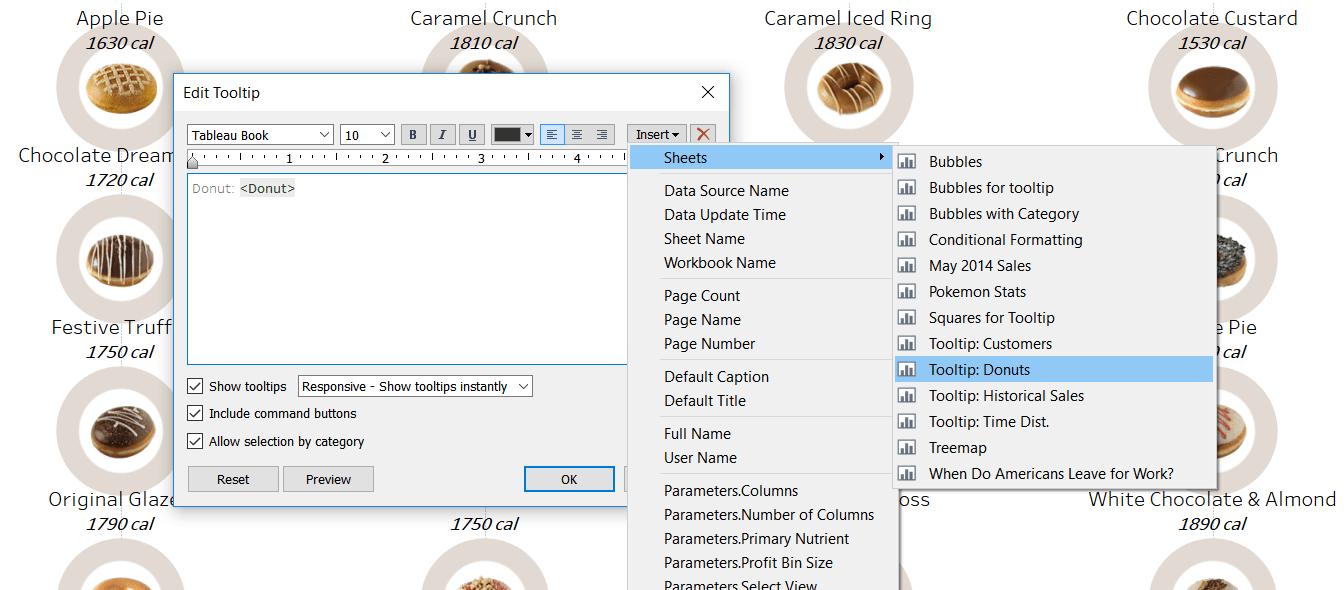
Once that step is completed, markup text will appear in the tooltip indicating that Viz in Tooltip is active. Through the markup, you can customize the size of the tooltip and specify the Selected Fields to filter to (this works just like filtering on Selected fields in Filter Actions). Tableau handles the rest automatically.
So why place vizzes into tooltips?
For one: it’s a phenomenal space saver. If you’ve ever created a meticulously designed dashboard or story - only to realize that you need to upend the entire design because you need to add a few more dimensions and measures - then this feature is for you. Viz in Tooltip allows you to save space and keep a clean design by adding supplemental data into the tooltip. The vizzes in your dashboards and stories tell the most immediate and important data, while the vizzes in your tooltips enrich with supporting data.
Here’s a good example: supplement the latest sales figures with historical trends in the tooltip - all without adding clutter to your existing views:
Viz in Tooltip is also a phenomenal new way to interact. Whether you’re on Desktop, in the browser, or on Mobile, you can hover, click, and tap to see rich visualizations appear in tooltips. These simple gestures encourage curiosity and exploration from the people viewing these vizzes and invite them to learn more about the data for themselves in a fun and engaging way. With Viz in Tooltip, we make an even stronger case to keep visualizations in the digital medium. If your users are predominantly printing or exporting, have them take a look at what Viz in Tooltip can do!
Tooltips are excellent canvases to convey data and we’ve just made them even more powerful in Tableau. You might’ve seen great examples of vizzes hosted inside tooltips on the latest viral infographics and visualizations in the media and on the Web at large. Until now, these have been difficult to create for yourself, often necessitating coding to get started. With Viz in Tooltip in 10.5, we’re proud to say that you can now accomplish the same types cutting-edge of visualizations in Tableau.
Keep up with the latest and greatest
Visit the Coming Soon page to see all features planned for Tableau 10.5. We’ll update the site throughout the beta period with more info and deep dive videos.
We are working hard to get Tableau 10.5 out the door, but first we need your input! We want your feedback as early as possible to catch any issues and ensure great new features. The features included in beta and in the final version of Tableau 10.5 may change over time as we complete beta testing.
Autres sujets pertinents

The Tableau+ Bundle with Premium AI, Enterprise Capabilities, and Premier Success
 24 juin, 2026

What is Tableau Prep?
 30 avril, 2026
Insights Wherever You Work: Meet the Tableau App for Microsoft 365
 16 mars, 2026