
LinkedIn Sales Navigator + Tableau
Visualize and analyze your Sales Navigator usage data in minutes.

Fuel Your Sales Strategy With Analytics
Seamlessly access your LinkedIn Sales Navigator usage data in Tableau and uncover insights that will drive your sales effectiveness and maximize productivity.
See how it worksAnswer Your Sales Navigator Questions Quickly
Dashboards to make your investment go further, faster
In just minutes, you can make these dashboards your own. Download the workbooks, connect to Sales Navigator, replace the data sets and voila: new, actionable insights. Never download another CSV file again.
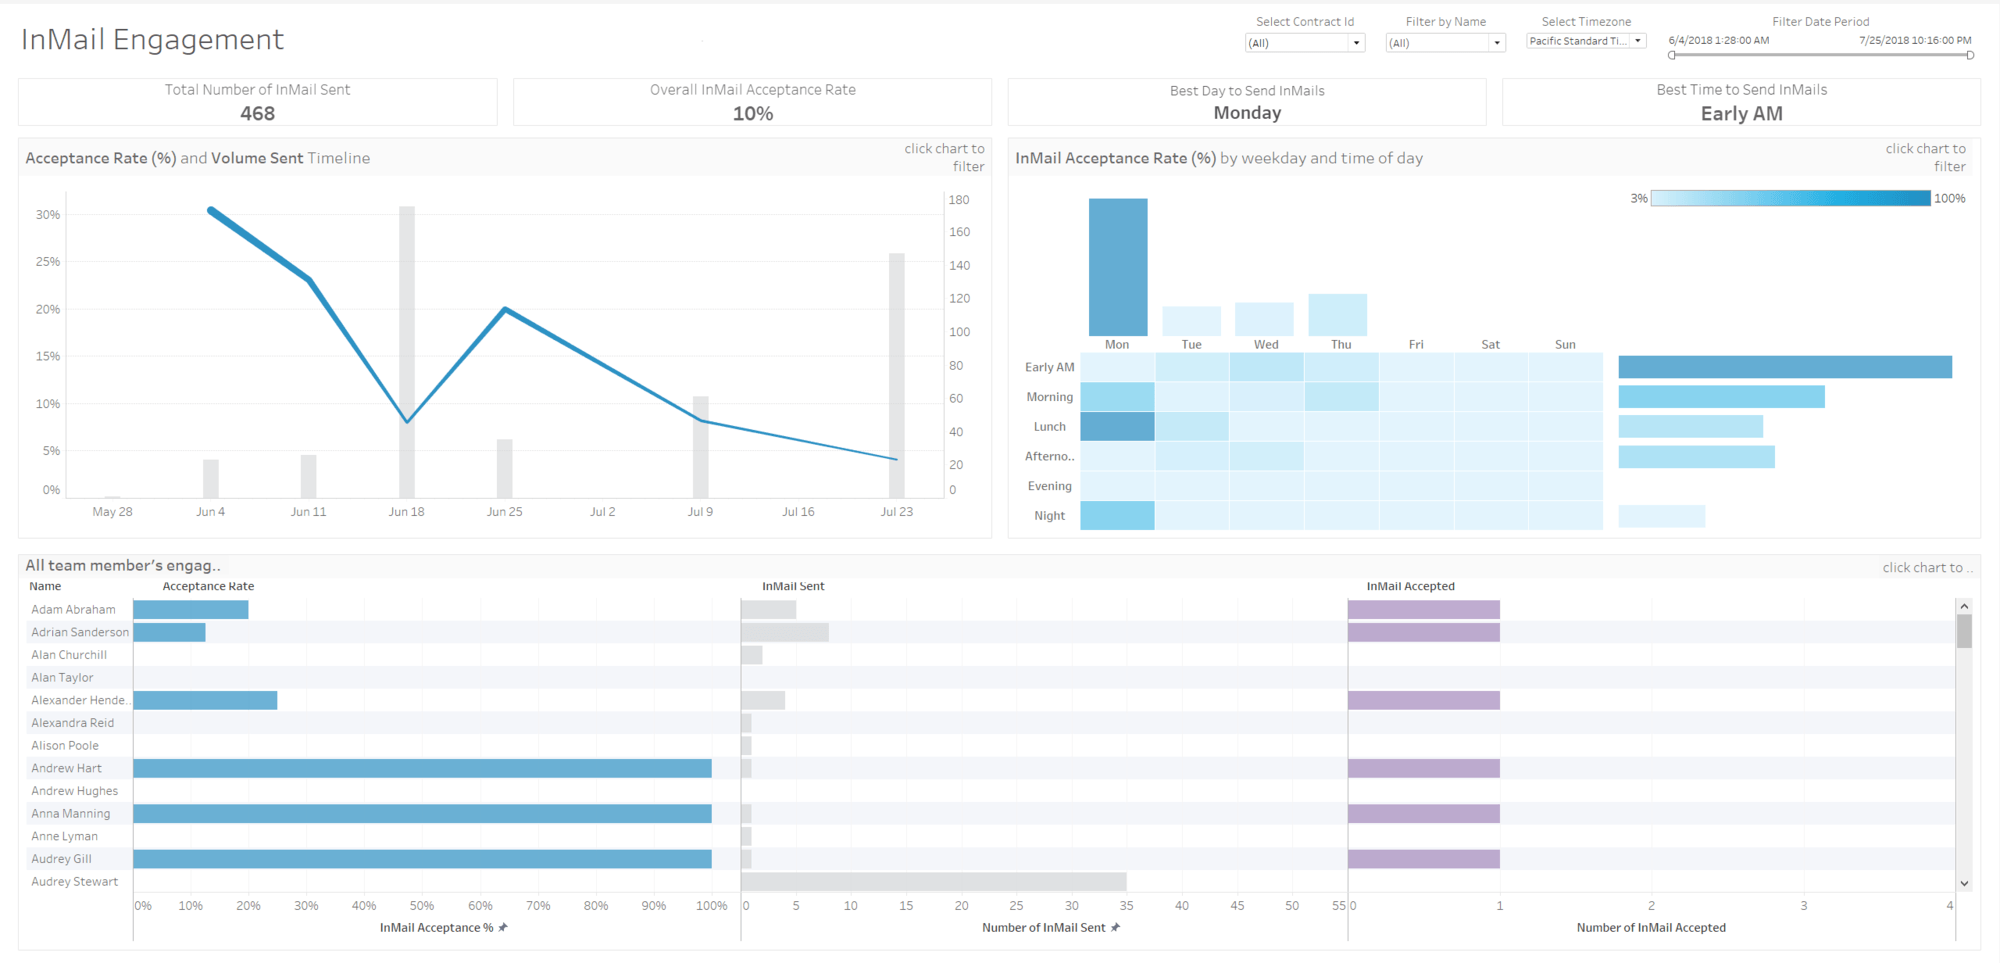
Interact with the Dashboard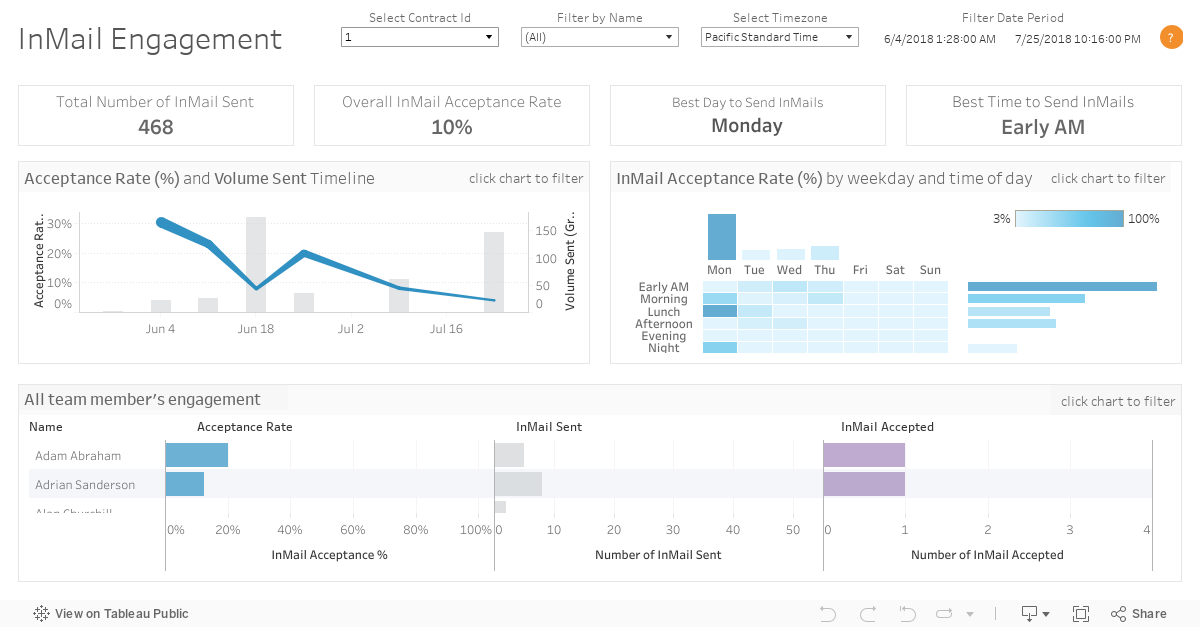

Optimize and improve sales performance
Measure relationship-building activities and improve team and rep performance by identifying areas of opportunities for training and coaching through our simple and powerful dashboards.
See how it worksAre you a Sales Navigator veteran, but new to Tableau?
Start with a free, fully operational two-week trial of Tableau Cloud. No credit card required.
Don't have LinkedIn Sales Navigator? Contact LinkedIn to learn more.
How to get started with Dashboard Starters for Sales Navigator
Before you begin: get the email address or phone number, and password for the LinkedIn Sales Navigator account.
You need an Sales Navigator Enterprise Plan and Sales Navigator administrator or reporting permissions.
You also need either Tableau Desktop version 2019.4 or later (or a free trial of it) or Tableau Cloud (or a free trial of it).
Option 1: If you have Tableau Desktop
- Download the Tableau Workbooks and then unzip them.
- Open the Tableau Workbook of interest and Select "OK."
- Right click on the dashboard at the bottom of the screen and select Unhide All Sheets.
- Click on one of the worksheets that appears at the bottom of the screen.
- Navigate to the Data menu and select New Data Source. Scroll through the list and click on LinkedIn Sales Navigator.
- Select Sign In from the LinkedIn Sales Navigator Analytics screen that appears.
- In the web browser that appears in a separate window, enter credentials for LinkedIn Sales Navigator Account and click Sign In.
- In Tableau Desktop, select the Sales Navigator Contracts and date range you wish to analyze
- Under Standard Connection, double click the data source matching the name of the dashboard you opened at the beginning of this process. That name is shown in the lower left corner of the screen.
- Click on a worksheet at the bottom of the screen. Data load times will vary by amount of data selected.
- Right click on the demo data source that has a blue check mark next to it. Then select replace data source.
- Return to the dashboard by clicking on it at the bottom of the screen. Adjust filters and interact with data to get insights about LinkedIn Sales Navigator usage.
Option 2: If you have Tableau Cloud
It's easy to create a Dashboard Starter. When the process is complete, you can edit the resulting workbook just like any other, quickly customizing it for your needs. For more on this process, see this help page.
- In Tableau Cloud, open the Explore page, then click the Create button and select Workbook.
- At the top of the Connect to Data window, click Dashboard Starter.
- From the list of pre-built designs, find the LinkedIn Sales Navigator Dashboard you need, and click Use Dashboard.
- To quickly see how a workbook looks with sample data, click Continue without signing in. Or click Continue to create a workbook with your data.
- Specify a name and containing project for the workbook.
- If you chose to create a workbook with your data, sign in to your data source. While Tableau prepares an extract of your data, sample data appears so you can explore the layout.
Additional resources for Sales Analytics
- Learn more about Tableau for Sales Analytics
- See more sales analytics dashboards
- Learn how to build dashboard in Tableau Sales Analytics Spotlight Webisodes