Enable Predictive Capabilities in Tableau Using Analytics Extensions


The typical analytical ecosystem has two silos: business intelligence and data science. Data scientists have a wide range of options to choose from when it comes to programming languages and platforms to build their predictive models. However, true return on investment is realized only when these models are used to leverage insights and make informed decisions that drive tangible value for the organization. Analytics Extensions do just that!
Analytics Extensions provide the flexibility you need, letting you choose the programming languages and platform of your choice to build and fine-tune models that can be used for dynamic interaction and report building purposes. At the root, an Analytics Extension is a server that you stand up to receive data from Tableau in real-time. This data can then be scored, transformed, or augmented to facilitate dynamic exploration.
Use Analytics Extensions in Table Calculations
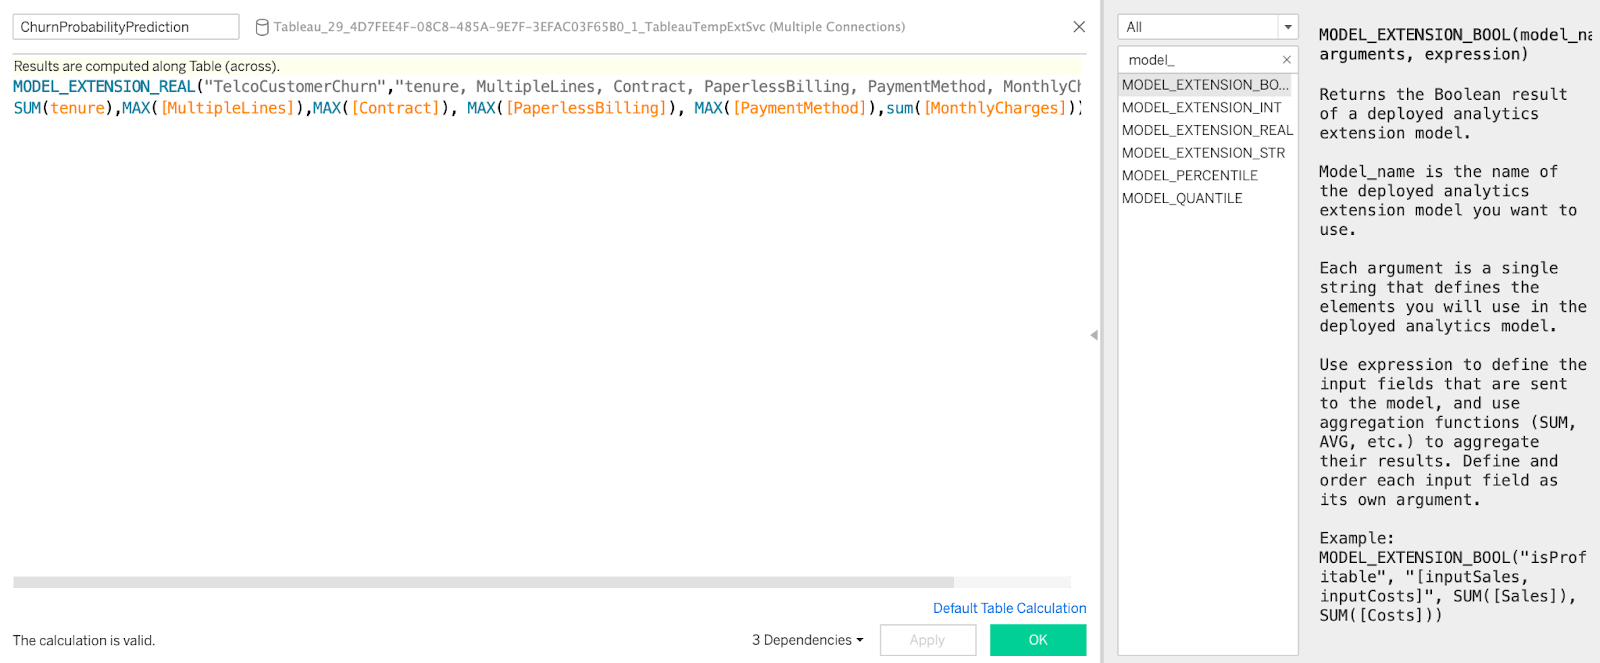
Table calculations trigger upon interaction and allow for dynamic what-if analysis. Similar to creating a calculated field in Tableau, you call a MODEL_EXTENSION function with the parameters of the model name, the arguments, and the expression in the order expected by the model. There are four variations of the model: MODEL_EXTENSION_BOOL, MODEL_EXTENSION_INT, MODEL_EXTENSION_REAL, and MODEL_EXTENSION_STR. To decide which function to use, simply select the one matching the type of value the model returns.
In the example below, a likelihood to churn model was deployed. Since this model returns a real number–the probability a customer will churn–the MODEL_EXTENSION_REAL function is used. Then in the function, we define the deployed model we’re invoking, the model’s inputs, and the values passed from Tableau to the model which can be either aggregated or disaggregated.
As for the output, we’ll receive a single column with the same number of rows as the amount we passed to the server (e.g., if we send 18 rows of data, we receive 18 rows back).
Enable Deeper Interactivity
To enable users to test out different scenarios, we can create another calculated field. This time with expressions replaced by their parameter counterparts. When doing this, make sure to only parameterize the fields you have influence over. For example, weather and economic patterns don’t make for good parameters since they’re outside of your control, whereas pricing, promotion, and marketing campaigns can be influenced and make sense as parameters. When parameters are changed, the extension server is triggered to dynamically compute predictions for the new record, and the updated values are seamlessly updated in Tableau.
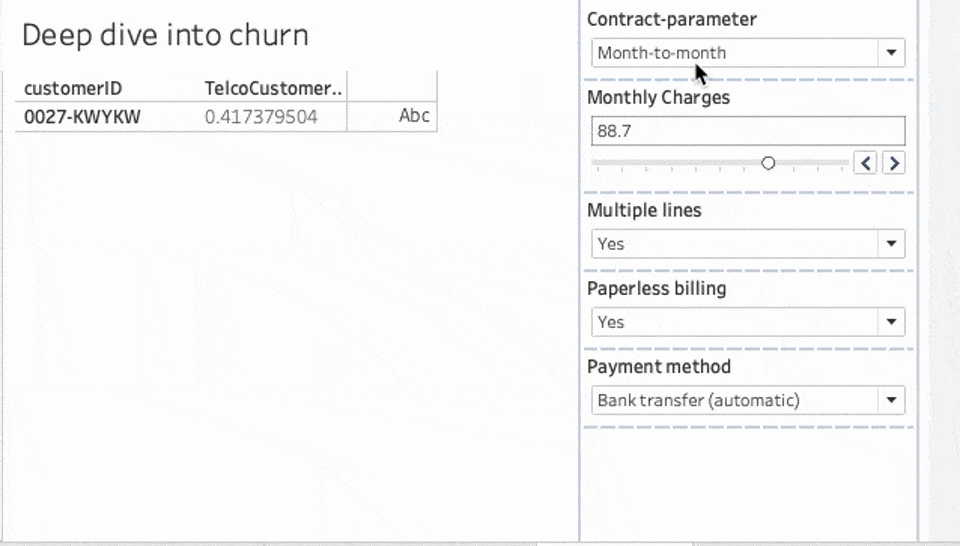
Using parameters in MODEL_EXTENSION functions is a powerful way to analyze complex scenarios in real-time, evaluate the impact of different variables on outcomes, and enable more informed and effective decisions.
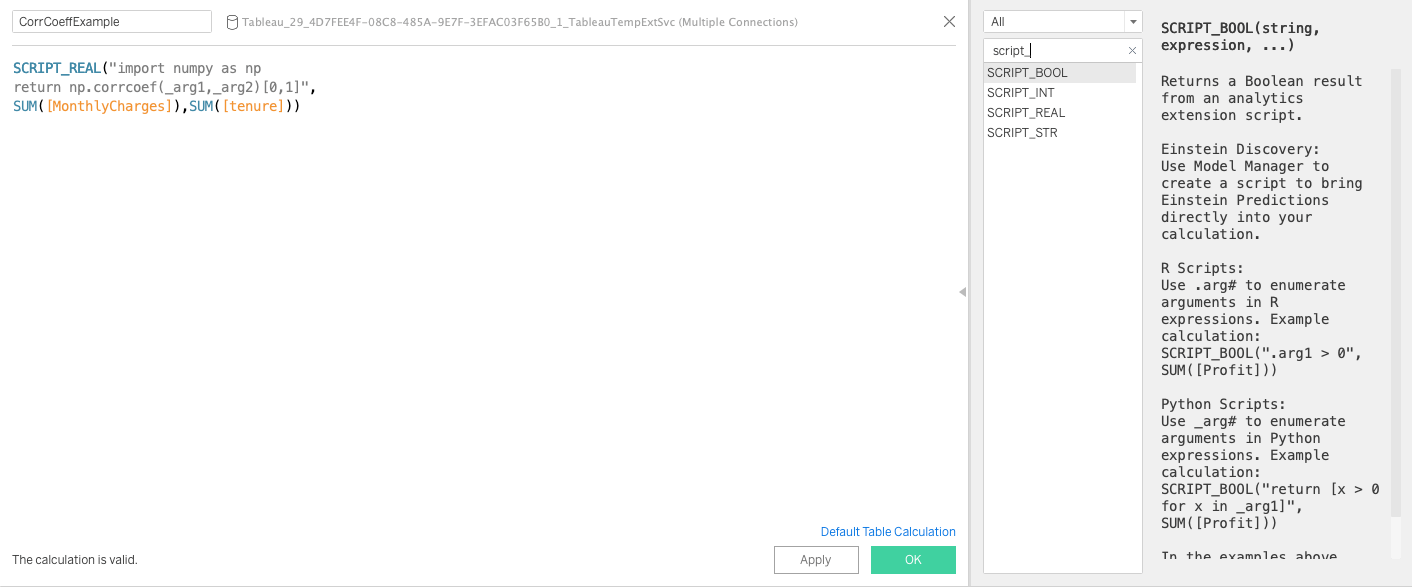
In addition to the MODEL_EXTENSION functions which directly query deployed models, you can use SCRIPT functions to run ad hoc scripts. In the example below, we use the SCRIPT_REAL function to compute the correlation coefficient between input variables ‘monthly charges’ and ‘tenure’ leveraging the numpy Python package.
Create Data Tables with Analytics Extensions Scripts
Table Extensions allow you to return entire data frames or data sources, overcoming the single column restriction in table calculations. Leveraging the code editor in the data source tab, you can write custom Python, R, or Javascript code. You can also optionally add tables to use as an input for the script/function. Similar to a live connection, Table Extensions refresh every time you open up a workbook or refresh a data source so you’re always working off the latest information.
By using Table Extensions, you can easily integrate scripts and advanced functions into Tableau to build complete predictive models, transform and shape your data, call web APIs to get real-time data, and more. Then you can use the output downstream to explore and visualize the data.
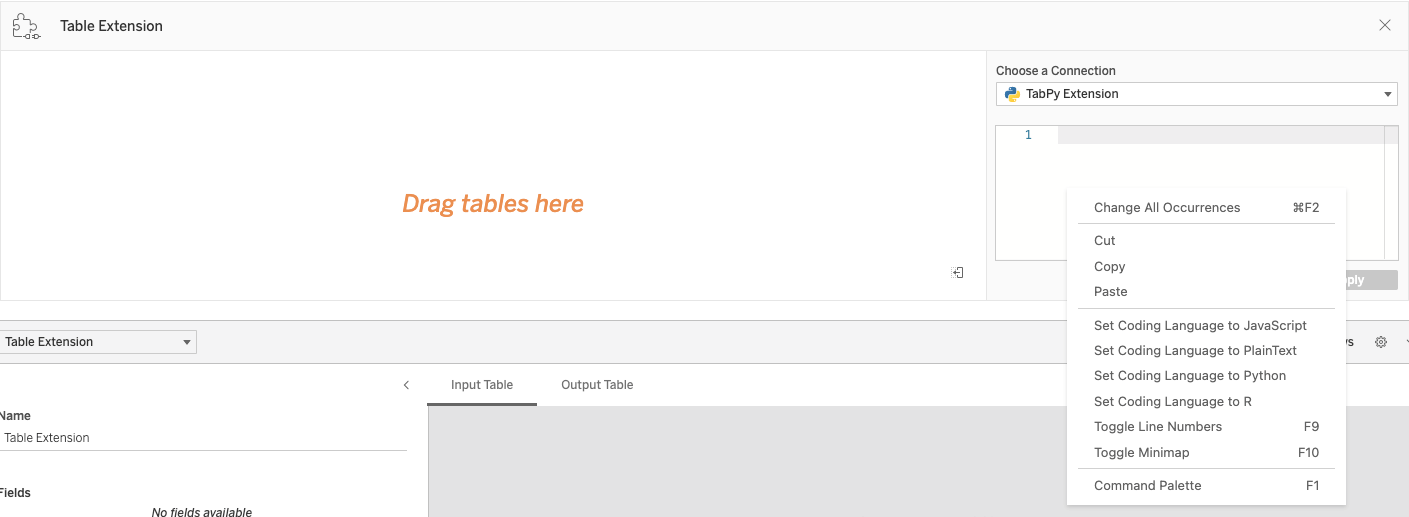
Now let’s walk through how to get started. First you must ensure you have established an Analytics Extensions connection from the sheet tab. To do this, head to the Analysis tab and select Manage Analytics Extensions Connections.
Once the connection is established, head to the data source tab, select New Table Extension and drag and drop it into your data model. Doing this will show you the code editor and give you the option to switch between the extension connections.
In this example, we wrote a Python script in the code editor to pivot a column from our data source. The output from this Table Extensions script is then combined with other data sources to create a composite data source that can be used for downstream visualization.
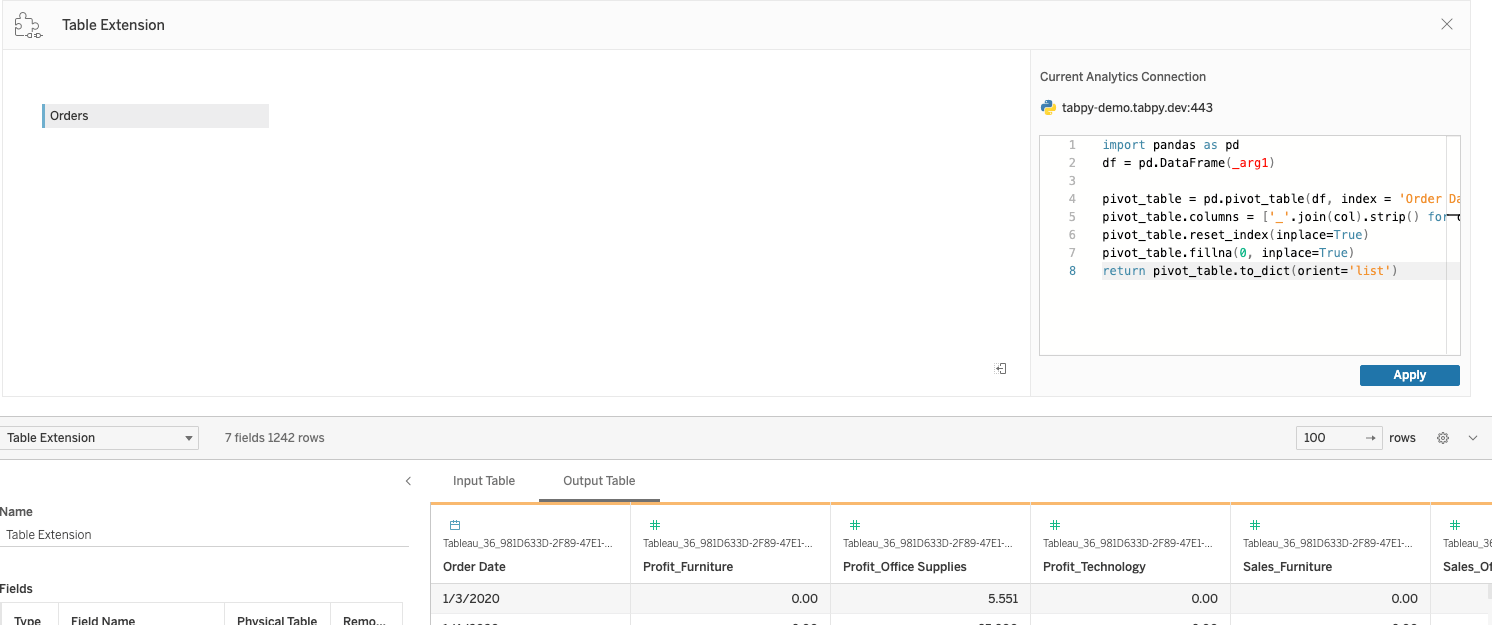
The script must return a dictionary or list of lists, essentially a JSON object. A script for RServe must return a data.frame or list of named lists while the script for Python must return a dictionary. In this example, we used the following explicit return command: return df.to_dict(orient='list') to accomplish this.
Table Extensions is a versatile option you can use for analyzing and extracting insights. It opens up new possibilities for data analysis in Tableau such as analyzing unstructured customer feedback or social media posts, with functions for sentiment analysis, topic modeling, and named entity recognition. It also facilitates web scraping, allowing you to collect and analyze data from external sources by providing functions for parsing both HTML and JSON data formats. And by enabling custom data processing, such as normalization or pre-cleansing, and feature engineering, Table Extensions can be leveraged in any way that best suits your needs. With the help of Analytics Extensions and Table Extensions, you can use predictive models to experiment, simulate, and compare various scenarios to optimize every decision.
Articles sur des sujets connexes

The Tableau+ Bundle with Premium AI, Enterprise Capabilities, and Premier Success
 juin 24, 2026

What is Tableau Prep?
 avril 30, 2026

Insights Wherever You Work: Meet the Tableau App for Microsoft 365
 mars 16, 2026