Tous les articles de
 Visualizations
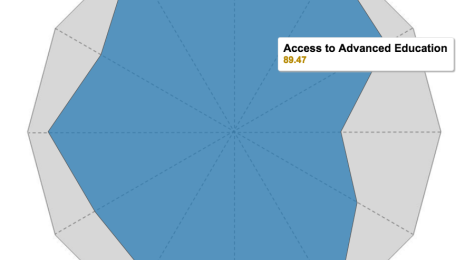
Utilisez un diagramme en radar pour comparer des dimensions sur plusieurs métriques
Les diagrammes en radar sont un excellent moyen de comparer les membres d'une dimension en fonction de plusieurs métriques. Imaginons par exemple que vous désiriez acheter un smartphone. Vous pouvez utiliser un diagramme en radar pour comparer plusieurs appareils en fonction de métriques diverses, telles que la durée d'autonomie de la batterie, la qualité de la caméra et la mémoire de l'appareil.

 Enterprise
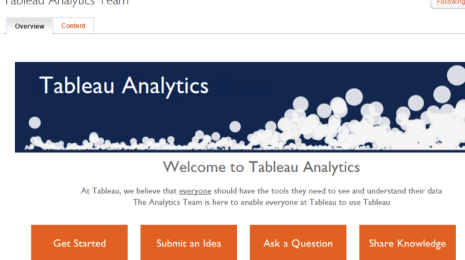
In a culture of self-service analytics, enablement is crucial
 juillet 30, 2015
So you want to build a culture of self-service analytics, and you understand the value of data sources. What comes next? Once users begin engaging with their data, they’re bound to have questions. That’s what we saw here at Tableau where every employee gets a copy of Tableau Desktop as well as access to data.
juillet 30, 2015
So you want to build a culture of self-service analytics, and you understand the value of data sources. What comes next? Once users begin engaging with their data, they’re bound to have questions. That’s what we saw here at Tableau where every employee gets a copy of Tableau Desktop as well as access to data.
 Data
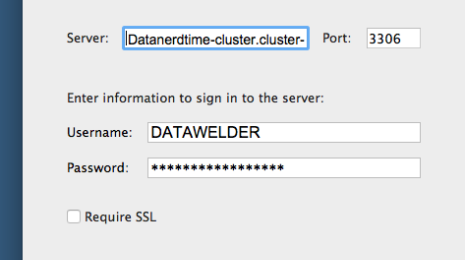
DataConnect Directly to Amazon Aurora
 juillet 28, 2015
We are pleased to announce a new database connector to Amazon Aurora as part of our 9.0.4 release.
juillet 28, 2015
We are pleased to announce a new database connector to Amazon Aurora as part of our 9.0.4 release.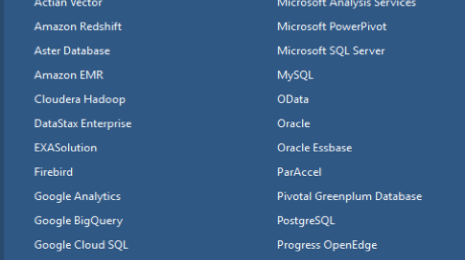 Product
Tableau 9.1 Includes SSO Support for SAP HANA
We’re excited to share Tableau Desktop 9.1 includes single sign-on (SSO) support for SAP HANA. This augments Tableau’s connector for SAP HANA. Connectors are also available for SAP BW, Sybase ASE and Sybase IQ. These connectors simplify your workflow, allowing you to connect once, then leave security to Tableau while you get into the flow of your data.
 Enterprise
Building a culture of self-service analytics? Start with data sources
juillet 23, 2015
In order to build a culture of self-service analytics, you need two things: the right tool, and the right support. Here at Tableau, we’re building that culture at scale with our own Drive methodology for company-wide implementation, and we’re seeing the benefits. We use our own product to engage with our data, and an internal team provides enablement support. The enablement process begins with what is perhaps the most crucial step: enabling users with data. Tableau Cloud
How Tableau & BigQuery ‘Harness the Complex to Make it Simple’
 juillet 21, 2015
Two years ago, Vente-Exclusive found itself overwhelmed with data. It had billions of data points on customer behavior, email campaigns, and shipping logistics, but it had no way to gain timely insights. Vente-Exclusive found a solution in Google Cloud Platform, a family of products on a pay-as-you-go model. But it still had a missing link: how to present the data to business users who don’t have any SQL knowledge?
juillet 21, 2015
Two years ago, Vente-Exclusive found itself overwhelmed with data. It had billions of data points on customer behavior, email campaigns, and shipping logistics, but it had no way to gain timely insights. Vente-Exclusive found a solution in Google Cloud Platform, a family of products on a pay-as-you-go model. But it still had a missing link: how to present the data to business users who don’t have any SQL knowledge?


