
The Municipality of Nijmegen uses Tableau to make informed, data-driven decisions on local policies and developments
Interactive, actionable insights allow Nijmegen to improve policies for its residents
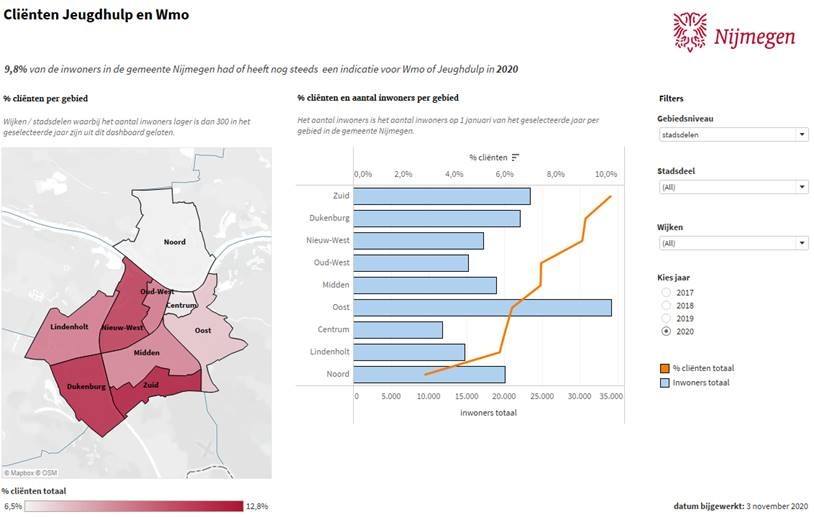
Improving referral process in healthcare reduces costs and improves care for citizens
Insights shared in Tableau Public empower local businesses to confidently respond to the Covid-19 pandemic
Nijmegen is the oldest city in the Netherlands, and the country’s tenth largest municipality. Located between the German Ruhr area and the Randstad, Nijmegen holds an important position in the international economy.
Danique Haas and Arjen Verhulst, Data Analysts at the Municipality of Nijmegen, are building an internal data culture, one department at a time. They discuss how their organization uses Tableau to gain insights in local developments, evaluate policies and to make timelier, data-driven decisions.
What role does data play in servicing your residents and local businesses?
For us, it is all about insights. The safety department, for example, needs insights on a strategic and a tactical level. Insights into safety or public spaces helps us not only to plan services or maintenance, but also to analyse trends that inform conversations and even future policies.
When looking at reports about nuisance behaviour, waste or broken streetlights, for example, we can compare which resources or areas are impacted more than others. This may prompt further investigation or discussions with local parties and stakeholders. A special investigating officer (buitengewoon opsporingsambtenaar (boa)) can take action in their district. Our citizens know they are being listened to because they see the municipality taking action more quickly.
Calibration and recalibration is now more frequent with the help of Tableau. Policymakers review weekly instead of monthly, allowing them to be much more agile in their work.
How does visual analytics impact local policymaking?
Tableau really helps our policymakers to see and understand their data. Visual analytics helps them to analyse trends in the municipality, and to map local developments at the district or even street level. This is hugely valuable information when evaluating policies and goals, and of course when working on new plans and policies. Calibration and recalibration is now more frequent with the help of Tableau. Policymakers review weekly instead of monthly, allowing them to be much more agile in their work.
We see a huge impact in Social Care (the Social Domain), where almost half of the municipal budget goes. It’s crucial to be able to account for expenditure as much as possible. A good example is a recent healthcare project where we needed to limit the number of referrals to individual custom facilities. This would ensure public funds are targeted, effective and would reduce costs, meaning the citizens receive the best quality care possible. Pulling from our data warehouse, we used Tableau to benchmark against KPIs. These insights were then used in the reporting for the intervention plan, providing a clear overview of objectives and results. Tableau makes life easier for our BI specialists; they previously had to manually tinker in Excel, but now Tableau provides an automatically updated view.
How is Tableau helping you through the ongoing COVID-19 pandemic?
The BI teams are actively monitoring the impact of the pandemic on the municipality. We’re analysing pedestrian footfall sensors closely, for example. This data is very important when enforcing 1.5-meter social distancing.
Tableau is helping us share insights with local entrepreneurs and businesses to give them a better understanding of the state of play compared to last year, such as analysing how busy the streets are. The data is shared via the municipality’s Tableau Public page and the Stads- en Wijkmonitor, helping local businesses make informed, data-driven decisions.
The data is shared via the municipality’s Tableau Public page and the Stads- en Wijkmonitor, helping local businesses make informed, data-driven decisions.
How are you evolving your data culture?
As an organization we are always exploring the possibilities and opportunities of using data, both internally and for external communication. We also work with Tableau partner Infotopics, who support us with the management of licences and Tableau Server – but also help us train employees, both in the classroom as through training on the job.
More and more employees see how data helps to evaluate policies and to make informed decisions. Having a trusted data source and ‘one single source of truth’ allows departments to accelerate their decision-making cycle.
Employees want to learn to work better with data and dashboards. That is why the organization is actively investing in training, and why we are keeping our fingers on the pulse to offer support where needed. We continuously monitor dashboard supply and demand and ensure optimal functionality and user friendliness. As a result, employees are finding actionable insights that actively improve policy and decision-making.
Are there learnings, tips or tricks that you would give to other companies that would like to embrace a data-driven way of working?
The biggest challenge is to decide what data to include and how to tell the data story. What works for us is to discuss ways of working in a classroom setup. We then literally show employees the basics of exploring and interacting with data, but also challenge them by making them look for specific information in the dataset, using real-life issues in a specific district.
We also work in sprints, as we do with our Scrum methodology. This allows us to realign and adjust every four weeks and gives us the opportunity to talk to employees regularly. That dialogue is beneficial for all parties involved - we can iterate on previous dashboards and improve data processes that aren’t running as they should. For us as data analysts it is really useful to stay in touch with so many different user groups. It helps us learn about their similarities and differences, ultimately helping serve them and the municipality better.
What does the future hold for you and Tableau?
Every department can gain something by being data-driven, enabling new ways of working to improve our processes and services. More and more departments are realizing the impact these insights have and ask us about Tableau. As for the future, we’d like to introduce more predictive analytics. For example, understanding the cost of the Youth Social Support Act (Wet maatschappelijke ondersteuning), or analyzing parking turnover and sales, such as parking rates versus visits, and how much revenue the municipality will receive.