M-net unlocks new potential and increases profitability

With roughly 840 employees and using a complex network of owned and rented landlines, M-net provides about 380,000 businesses and households throughout southern Germany with telephone, internet, and TV services at various bandwidths.

When M-net decided to create a visual break-even analysis for all lines, ports, and service areas, they used Tableau's mapping capabilities to better understand their geographic regions. This new solution reduced the manual effort required for profitability calculations from days to a few mouse clicks. And this new transparency allows teams to assess capacities and profitability within moments to quickly identify under-performing regions, leading to more proactive countermeasures and securing a long-term increase in profitability and competitiveness.

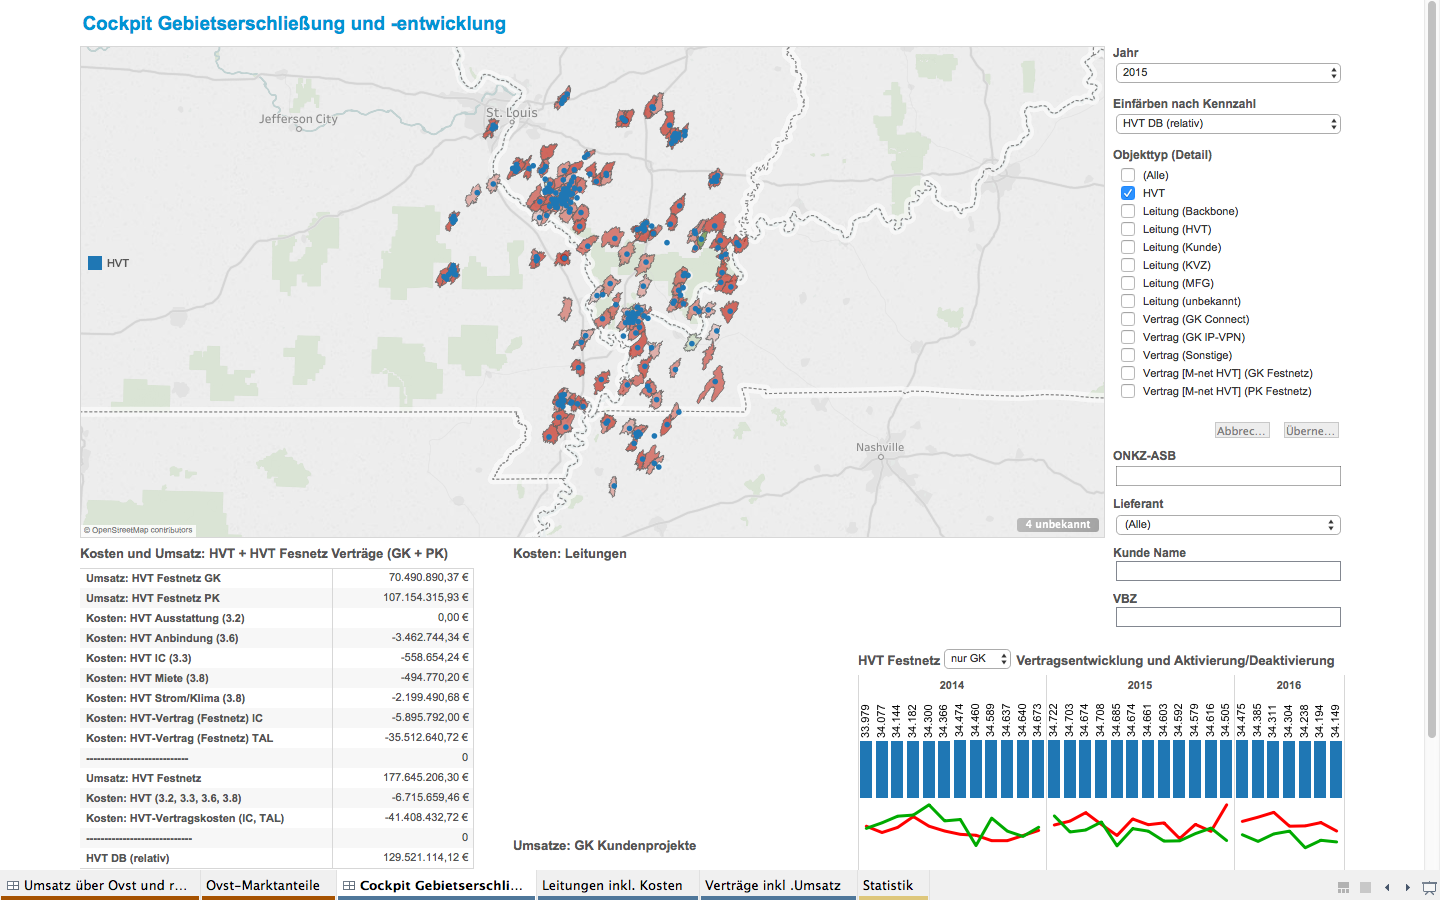
Interactive dashboard showing service area development and infrastructure
Competitive pressure and complex network topology hamper profitability
Competition in the telecommunications market is increasing, affecting pricing and low-bandwidth subscriber line numbers. This makes it difficult to balance service coverage and profitability. It is also challenging to identify areas that warrant infrastructure investments and to measure business effects from declining prices, new technologies, or additional competitors.

Markus Kolp, Business Intelligence Analyst
"Correctly attributing the various costs proportionally to each individual customer required a deep understanding of each cost factor,” recalls Markus Kolp, Business Intelligence Analyst at M-net. “The necessary data came from a number of diverse sources such as SAP, billing, third-party calculations for rented lines, address data, technical documentation of line capacities and many more." If customer numbers or line capacities in surrounding areas changed, the analyses had to be rerun. Every customer request for additional bandwidth required a time-consuming investigation of technical and cost-relevant circumstances. Due to the complexity, there was always a risk of neglecting or misallocating important information. And spreadsheets made it difficult to quickly understand data surrounding bandwidth capacities.
Visual breakeven analysis to deliver transparency and inform decisions
M-net decided to target the root of the problem. "We wanted a tool that would automatically consolidate the required data and allow easy individual analysis. But at the same time we wanted it to offer geographical visualizations of areas or regions in the form of maps," explains Markus Kolp. The in-house Oracle data warehouse did not include all the relevant data sources, so the new tool also needed to be able to easily connect to many diverse data sources and allow for advanced analytics.
By knowing exactly what the cost-benefit ratio is at each and every connection point, M-net is able offer custom tailored and profitable solutions to private households and business customers alike. That gives us a significant competitive edge.
Tableau comes out on top
M-net originally used ArcGIS to map profitability by customer. But it quickly became clear that this would require a disproportionate amount of time and labor to scale across business units. "In the end, we decided to go with Tableau," says Markus Kolp. "Especially because it was best able to handle the geographical visualization."
Capacity, cost, and revenue data with a few clicks
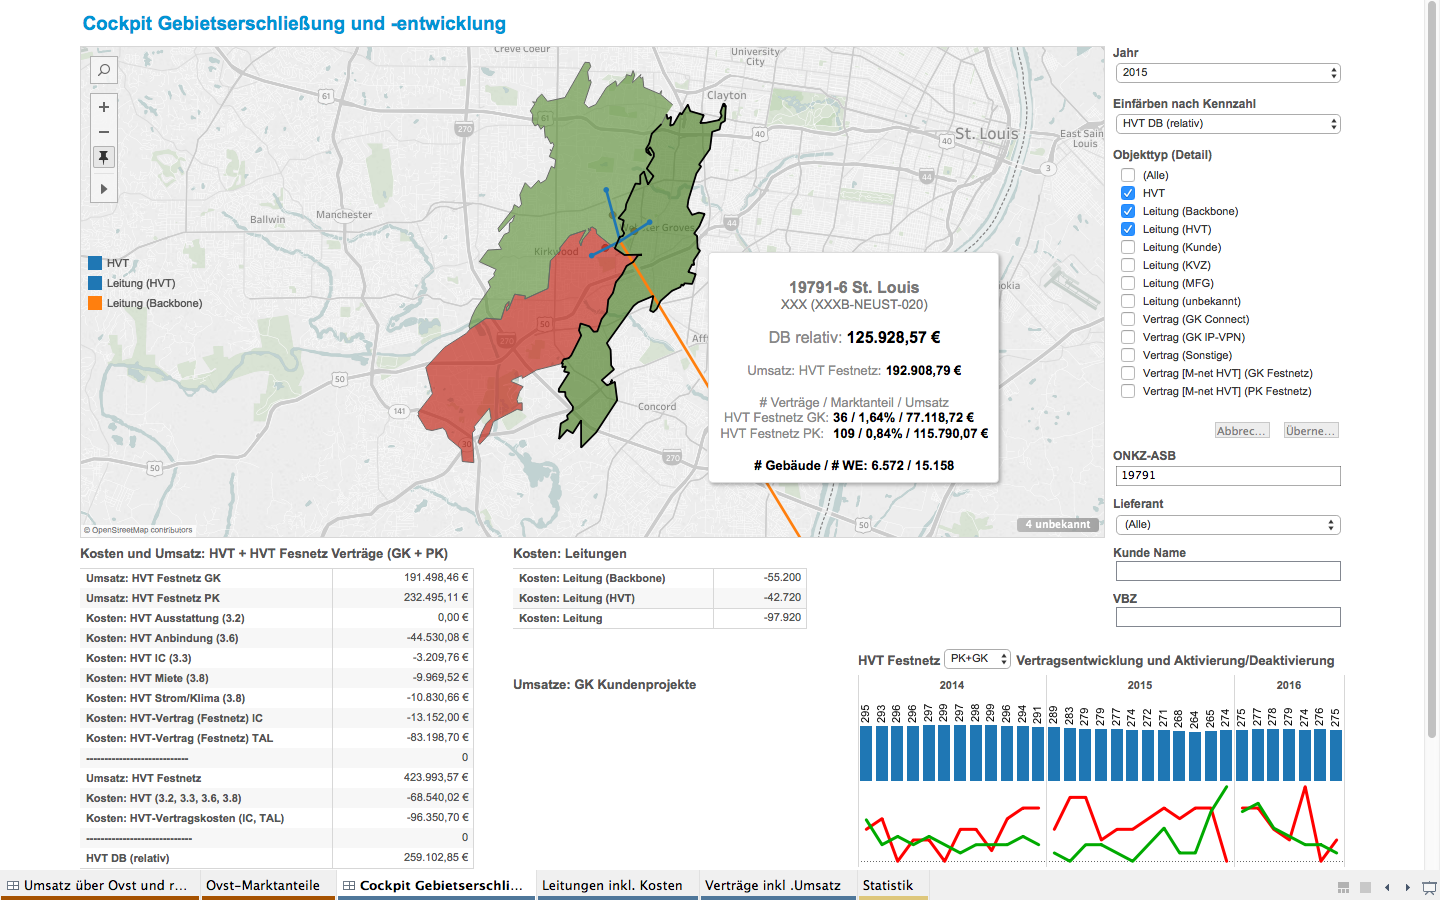
Once the decision was made, M-net purchased ten Tableau Desktop licenses and started to develop a set of dashboards for analysis and presentation that included business and technical data of both their customers and networks. This was internally nicknamed the “Expansion Cockpit.” Today, about 20 employees from the strategy, technology, and sales departments regularly use the new Tableau solution. Users can see a map of the more than 300 connected MDF (Main Distributor Frame) service areas. They can also track essential key performance indicators (KPIs) such as revenue, costs, number of contracts, employed products, or market share and the development of these KPIs over time. The Expansion Cockpit shows data of both the business and technical sides of the M-net network. Employees can drill into technical data such as network topology, backbone lines, and MDF connections, including their respective bandwidths. At the same time, they can see the entire customer journey through details like line contract run time, costs, revenue, address, or technical connection info.
Today, we can discern at a glance situations and their underlying conditions that were very difficult if not impossible to spot before when simply looking at spreadsheets.
Easy integration with existing IT infrastructure
The business intelligence team led by Markus Kolp creates and distributes reports via email. Employees view them with Tableau Reader. A variety of departments at M-net use Tableau dashboards to drive decision making. The strategy department uses the analyses to create long-term forecasts and to validate investment decisions. The technology department always has the latest information about connection types and network capacities across regions. And the controlling department gains important insight into the profitability of customers and infrastructure. Aside from the Expansion Cockpit, M-net uses Tableau for a number of other applications at M-net. The engineering department, for example, is improving their level of service by monitoring network traffic data, analyzing performance, identifying high traffic volumes and evaluating error messages by frequency and processing time. The finance department uses Tableau to monitor customers' payment performance, identify credit risks and fraud attempts and to analyze unpaid items over time. And the strategy department is running a customer intelligence program to identify general and region-specific trends in their data about customers, contracts, revenue, costs, usage, and competition. This allows them to provision for future requirements ahead of time. Today, employees benefit from self-service analytics. To on-board customers, M-net relies on online training resources and the Tableau community forums. We were able to work our way into Tableau independently," says Markus Kolp. "The online documentation and the Tableau-Community were very helpful. Other than that, we do benefit from exchanging information with Tableau employees and we regularly visit Tableau Conference."

Delivering virtually all relevant data to the users fingertips, this interactive dashboard enables detailed insights
Massive time savings from days to clicks with added transparency & profitability
For many M-net employees, the new Tableau solution has changed the way they work. Technical analysis or profitability checks used to require days, collecting revenue and cost numbers from various data sources. Then everything had to be proportionally attributed and calculated in massive spreadsheets. With Tableau’s native connectors, the business intelligence team brings in data from their Oracle data warehouse. And now, they can bring other data sources, enriching their analysis. Today this type of analysis only takes a few clicks. This time savings allows M-net technicians to forecast the effects of current and future customer numbers on network performance. Decisions become more proactive as technicians can order additional capacity or cancel superfluous bandwidth as needed. Typical questions such as revenue over time or churn rates are answered at a glance. Tableau’s mapping capability allows employees to drag and drop KPIs—helping them understand how individual items are interconnected within the big picture. "Today, we can discern situations at a glance, along with their underlying conditions. Before, they were very difficult, if not impossible to spot with spreadsheets," Kolp explains. "But our Tableau solution doesn’t just save us a lot of work with each analysis," he adds. "The KPIs in our Expansion Cockpit are always up to date. We don’t have to recalculate them every couple of weeks as customer numbers or network capacities change."
Investment decisions such as connecting new service areas or adding network capacities are now based on reliable information. That opens up additional business opportunities while at the same time greatly reducing our risk.
Creating competetive differentiators
With the new transparency regarding its network topology and the cost-benefit situation of every individual customer, M-net identifies unprofitable MDF areas. M-net has already begun implementing countermeasures – such as purchasing cheaper lines, reducing line capacities, redoubling sales efforts, or completely abandoning unprofitable areas – in order to restore or improve profitability. "In the mid- to long term, we are definitely going to see the results of these activities in our bottom line," Kolp assures us. "Our success with Tableau has percolated through the entire company. More and more colleagues come to us with additional ideas or requests. And many other data analysis use cases for Tableau are becoming apparent. There is a huge potential for optimization that we want to tap into over the coming weeks and months." The team is moving all geographic analyses and reports, previously distributed over ArcGIS and email, into interactive Tableau dashboards. The insights gained from using the Expansion Cockpit are already driving its further development and generating new requirements. There is a desire to meet future challenges with the support of data. For example, there are plans to add all Telekom MDF locations – including those not used by M-net – and related market and competition information to the Expansion Cockpit. Markus Kolp sums up his experience with Tableau: "By knowing exactly what the cost-benefit ratio is at each and every connection point, M-net is able offer custom tailored and profitable solutions to private households and business customers alike. That gives us a significant competitive edge. Investment decisions such as connecting new service areas or adding network capacities are now based on reliable information. That opens up additional business opportunities while at the same time, greatly reducing our risk."