Weniger zeitaufwendige Finanzanalysen dank Tableau


 Hinweis des Herausgebers: Früher entwickelte Sam Finanzfunktionen für InterWorks, zum Beispiel auch für das Reporting der Leistungsanalysen. Dieser Beitrag basiert auf seinen Originalblogs aus der Reihe „Tableau for Finance“, die von InterWorks herausgegeben wird.
Was ist die kostbarste Ressource in Ihrem Finanzteam? Vermutlich sagen Sie: die Mitarbeiter. Mal angenommen, Sie verfügen über die richtigen Leute mit den richtigen Fähigkeiten in den richtigen Positionen, wie würde Ihre Antwort dann lauten? Ich würde antworten: Zeit.
Zeit ist in meiner Welt Mangelware, und ich bin mir sicher, dass viele Finanzteams vor derselben Herausforderung stehen. Meiner Erfahrung nach erstellen die Finanzabteilungen stoisch und beharrlich ihre Berichte, um die sportlichen Termine einzuhalten. Doch befassen wir uns jemals damit, ob Stoizismus und Beharrlichkeit zur optimalen Nutzung der Zeit führen und den Druck mindern, wenn die Zeit mal wieder knapp wird? Ich möchte mich näher mit dieser Frage befassen und auf eine Ressource aufmerksam machen, die mir, meinem Team und meinem Unternehmen eine große Wertschöpfung beschert hat.
Die Sicherheit und die Grenzen von Excel
Ein Großteil der vom Finanzteam verfassten Berichte wird in Excel erstellt. Das ist die Ressource der Wahl, mit der man nichts falsch machen kann. Seit jeher bietet Excel Funktionen, die sich leicht in Formeln anpassen lassen.
Ich habe schon längst den Überblick darüber verloren, wie viele Arbeitsmappen ich in Excel erstellt habe, die jetzt nur noch Momentaufnahmen sind, anstatt eine Aggregation von Echtzeitdaten darzustellen.
Mir ist bewusst geworden, dass die größte Einschränkung von Excel darin besteht, wie schnell die Berichte veraltet sind, sobald neue Transaktionen oder Anpassungen in unserem Abrechnungssystem stattfinden, und wie häufig diese Berichte neu erstellt werden müssen. Bevor ich überhaupt dazu komme, mehr oder weniger Excel-kundigen Endbenutzern eine mehrere Blätter umfassende Arbeitsmappe zu erläutern, wird schon kostbare Zeit verschwendet.
Außerdem müssen Formeln kontrolliert, die Genauigkeit des Berichts überprüft und hinzugefügte Daten oder von der Geschäftsleitung gewünschte Änderungen an der Darstellungsweise des Berichts eingearbeitet werden. Häufig erledige ich all diese Schritte auf einmal – wegen des Zeitmangels. Und das Reporting und die Analysen sind nur ein Teil meines Aufgabenbereichs.
Ich bin wirklich stolz darauf, eine komplexe Formel mit geschachtelten Aggregationen, LOOKUPS und IF-Anweisungen zu erstellen, die Daten aus mehreren Blättern zusammenführt und 20 Zeilen lang ist, denn sie sieht wie ein Kunstwerk aus!
Doch die Formeln werden immer länger und ziehen Daten aus immer mehr Quellen heran. Deshalb wird es immer schwerer, die Genauigkeit zu kontrollieren und zu bewahren. In einer perfekten Welt ändert sich der Form der Daten in der Quelle nicht, und Sie müssen nur aktuelle Daten importieren. Das ist aber nur selten der Fall.
Irgendwann kommt Excel an seine Grenzen und STÜRZT AB! Die Arbeit geht verloren, und noch mehr Zeit wird damit verbracht, alles wiederherzustellen. Die gute Nachricht lautet: Wenn Sie Tableau verwenden, müssen Sie sich nicht mehr mit diesen Problemen herumschlagen.
Mit Tableau erzielte Automatisierung und Zeitersparnis
Tableau verschafft den Finanz- und Geschäftsteams wieder mehr Zeit. Das habe ich selbst erlebt. Auch die Mitarbeiter, die diese Berichte verwenden, sparen [mit Tableau] Zeit, weil wir die Berichte gemeinsam erstellen und bearbeiten, um für mehr Interaktion und ein besseres Verständnis zu sorgen.
Ich komme ursprünglich aus dem Rechnungswesen, ich kann also weder programmieren, noch Skripte schreiben. Ich habe etwas Zeit gebraucht, um mich beim Reporting und bei meinen Analysen auf Tableau umzustellen. Ob ich froh bin, diesen Sprung ins kalte Wasser gewagt zu haben? Und wie! Wenn ich das nur früher gemacht hätte. Verstehen Sie mich nicht falsch: Excel ist aus meiner Welt noch immer nicht wegzudenken, allerdings spielt es jetzt eine andere Rolle. Tableau ist die Lösung meiner Wahl.
Wie spart Ihnen Tableau Zeit?
Ich muss täglich 10 Stunden Arbeit in einen 8-Stunden-Tag quetschen. Ohne Tableau müsste ich sogar 20 Stunden Arbeit an einem 8-Stunden-Tag bewältigen. Ich würde gern einige entscheidende Funktionen von Tableau hervorheben, die mir helfen und von denen auch Sie profitieren können.
Live-Datenverbindungen
Vermutlich reagieren Sie jetzt so: Wie kann ich denn eine Live-Verbindung zu den Unternehmensdaten herstellen? Eine wesentliche Tableau-Funktion sind die Verbindungen zu Datenquellen, die kein Programmieren erfordern. Sie können Verbindungen zu den meisten Datenbanken herstellen, wenn Sie über die passenden Berechtigungen verfügen (wie im Bild unten dargestellt). Wenn eine Live-Verbindung zu Ihrem CRM-System besteht, aktualisieren sich die Tableau-Berichte in Echtzeit oder nach Plan. Und wenn Sie auf Excel-Arbeitsblätter erpicht sind, können Sie auch zu diesen eine Verbindung herstellen. Unten ist der erste Bildschirm dargestellt, den Sie beim Start von Tableau sehen:
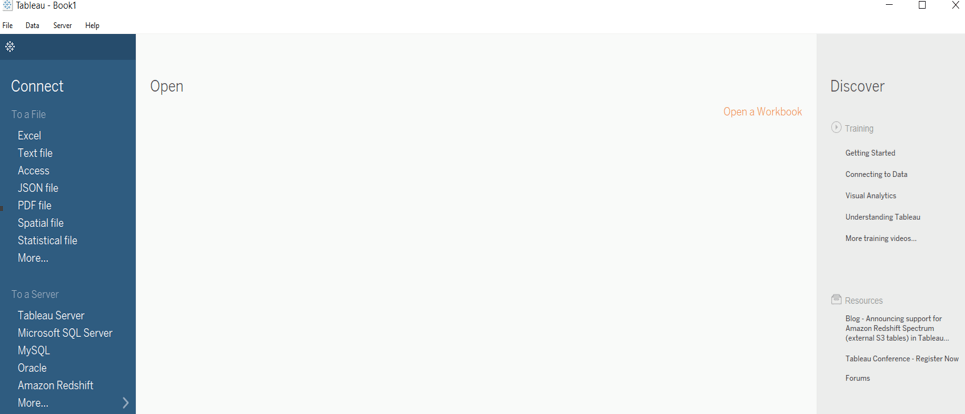 Oben: Der erste Tableau-Bildschirm enthält eine Auswahl der Verbindungen zu Datenquellen.
Automatisierung
Wie viele Ihrer Berichte werden jeden Monat manuell in Excel erstellt? Die Anzahl der Berichte ist dabei gar so nicht wichtig. Es kommt vielmehr darauf an, wie viel Zeit Sie für die Datenvorbereitung, die Formelerstellung, die Datenprüfung und das Erstellen der Berichte aufwenden.
Tableau übernimmt sämtliche Datenaktualisierungen, um Ihnen sehr viel Zeit zu sparen. Wir haben einige Dashboards veröffentlicht, die in zwei Kategorien unterteilt sind: Performance- und Compliance-Reporting. Die aus den Daten gewonnenen Erkenntnisse dienen uns als Entscheidungsgrundlage. Deshalb wollen wir unseren Entscheidungsträgern aktuelle Daten an die Hand geben.
Ein mit Tableau erstelltes und veröffentlichtes Dashboard unterstützt Selfservice-Analytics – wie auch immer Ihre Reporting-Anforderungen aussehen mögen. Dank automatisierter Datenaktualisierungen oder Filteraktionen ist nur ein Minimum an Wartung erforderlich, um die für Ihre Zielgruppe relevanten Aspekte der Analyse zu isolieren.
Eine Excel-Arbeitsmappe könnte beispielsweise:
- Automatisch jede Stunde aktualisiert werden
- Den Benutzern über den Browser rund um die Uhr Zugriff auf den Bericht gewähren
- Einzelnen Benutzern das Filtern der Daten gestatten
- Ein Abonnement anbieten, damit die Benutzer diese Arbeitsmappe automatisch jeden Tag erhalten
- Basierend auf den Benutzer-Anmeldeinformationen unterschiedliche Bearbeitungs-, Interaktions- und Download-Berechtigungen gewähren
Zusammenführungen, Verknüpfungen und Verschmelzungen
Sobald Sie die Verbindung zu einer Datenquelle hergestellt haben, werden Ihnen alle Blätter oder Tabellen in Ihrer Datenbank angezeigt, die sich vereinigen lassen. In Excel müssten Sie hierzu VLOOKUPS, SUMIFS oder Links zu blattübergreifenden Formeln in Erwägung ziehen.
Nachdem Sie das Framework Ihrer Vereinigung oder Verknüpfung entschlüsselt haben, merkt sich Tableau Ihre Auswahl für die künftige Nutzung. Wenn Zeilen und Spalten hinzugefügt werden, müssen weder Lookups aktualisiert, noch Formeln überprüft werden.
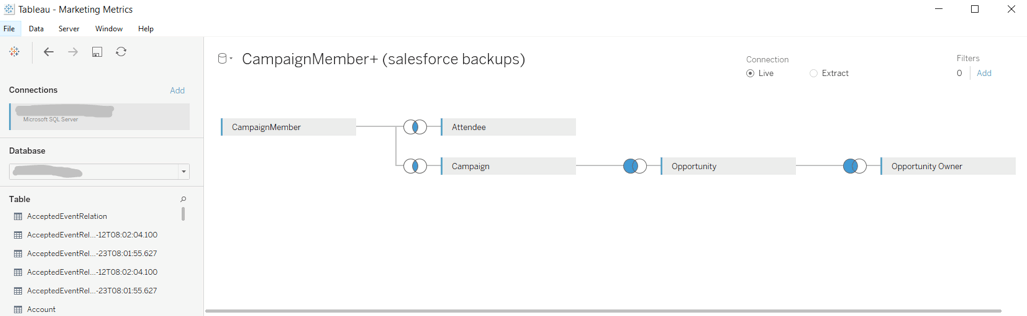 Diese Ansicht stellt mehrere Tabellen aus Salesforce dar, die mit einer einfachen Drag-&-Drop-Funktion verknüpft werden.
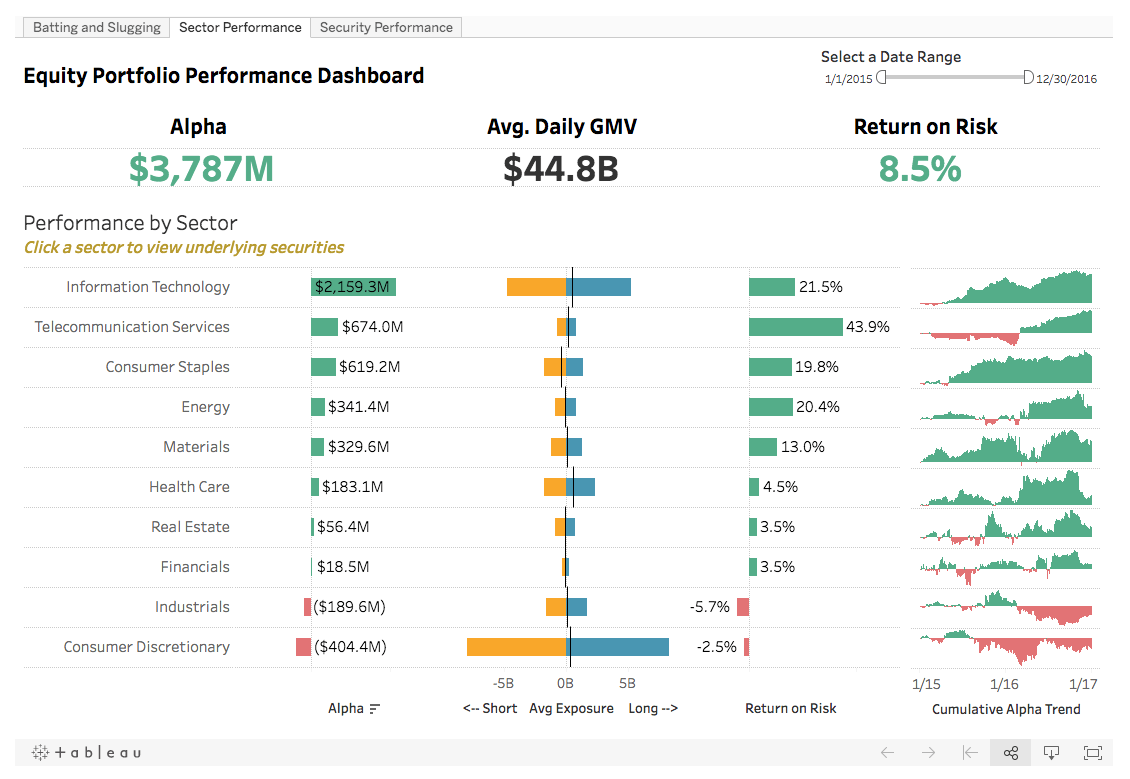
Dieses Dashboard gestattet es den Teams, sich die Equity Performance nach Sektor anzusehen und die Details zu den zugrundeliegenden Wertpapieren abzurufen.
Die drei oben hervorgehobenen Funktionen haben die Art und Weise verändert, wie ich mit Finanzdaten arbeite. Doch damit kratze ich nur an der Oberfläche der Möglichkeiten, die Tableau bietet. Je eingehender ich mich mit dieser Plattform befasse, desto größeren Nutzen ziehe ich aus ihr. Wenn Sie noch weitere Möglichkeiten kennenlernen möchten, wie die Visual Analytics von Tableau für eine Wertschöpfung sorgen und Ihren Finanzteams Zeit verschaffen, finden Sie hier den vollständigen Bericht.
Auch wenn dies für Sie noch völliges Neuland sein mag, werden Sie schnell erkennen, wie einfach die ersten Schritte sind.
Zugehörige Storys

Let Tableau Write Your SQL for You
 9 September, 2024

VizQL Data Service from Tableau: Use Your Data, Your Way
 8 August, 2024

When and How to Use Multi-fact Relationships in Tableau
 1 August, 2024
Blog abonnieren
Rufen Sie die neuesten Tableau-Updates in Ihrem Posteingang ab.