Optimizing your Amazon Redshift and Tableau Deployment for Better Performance
Download this free whitepaper
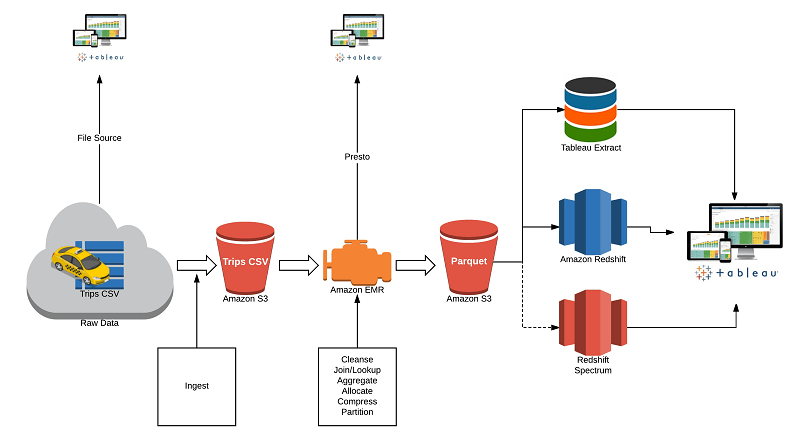
Amazon Redshift and Tableau are two powerful technologies in a modern analytics toolkit. Combined, they form a data warehousing and analytics solution that allows users to analyze datasets, running into the billions of rows, with speed and agility to drive better business outcomes. They are integrated out-of-the-box, so you can connect Tableau to your Amazon Redshift data warehouse with minimal time or effort. It’s important to understand how to optimize when integrating the two together, and doing so can yield considerable performance gains and ultimately shorten deployment cycles.
This paper introduces infrastructure advice as well as tips and hints to make the joint solution more efficient and performant.
Get the whitepaperビッグデータがメインストリームとなりつつある本当の理由は、データサイエンティストや技術者だけでなく一般のビジネスパーソンもデータを活用できるという点にあります。そこで大きなカギを握っているのが、ビジュアライゼーションです。単に情報を伝達し、数字やグラフを提示するだけでなく、そのチャートやグラフに命を吹き込めるのがビジュアライゼーションの良さです。
See what others are doing with Tableau on AWS
Do more with Tableau and AWS products
View customer stories and whitepapers
取り上げられました