University of West Florida Saves Time, Improves Data Quality with Tableau
UWF has been operating on a legacy student data system which is due to be sunsetted by Fall 2014.
More than 40 years’ worth of UWF student data—including 1.5 million alumni course records—would need to be quality-checked and then converted to the new system. Even more time-consuming, the IT team needed to recreate dozens of reporting application interfaces, so that administrators and other users across UWF could access the specific information that they needed from the new system.
An Older System Leads to New Challenges
“When you go through a system conversion like that, the amount of work is almost unfathomable,” says Melanie Haveard, Chief Technology Officer at UWF. “We built this system over 25 to 30 years, and it was perfectly tailored to what the users wanted. And we have to convert all of that in a two-year time frame to this new system that doesn't have all those bells and whistles.”
Each web application in the new system would need a reporting component that met users’ exacting expectations.
For example, says Haveard, a typical reporting request might be: “I need this web application, and I need to be able to see that by department, and I need to be able to see that by faculty member, and it needs to do all of that sorting.”
Haveard’s team also had to ensure users could continue to access to current student data throughout the conversion project.
"When you go through a system conversion like that, the amount of work is almost unfathomable."
“You can't do a conversion like this all at once,” says Haveard. Because data is converted in batches, some student data will be converted into Oracle while other information still resides in the SQL Server database. In order to have a complete view of current students, the IT team needed to be able to combine data from both databases into a cohesive view.
It was also crucial that the data be correct—or “clean”—before it was transferred into the new system. Haveard points out that basing decisions on incorrect data undermines the decision-making process itself. If a decimal is left out of a single entry in a range, for example, that can throw off an average significantly.
Visualizing a Solution
Haveard realized that she already had a tool that could help her team address these issues—Tableau.
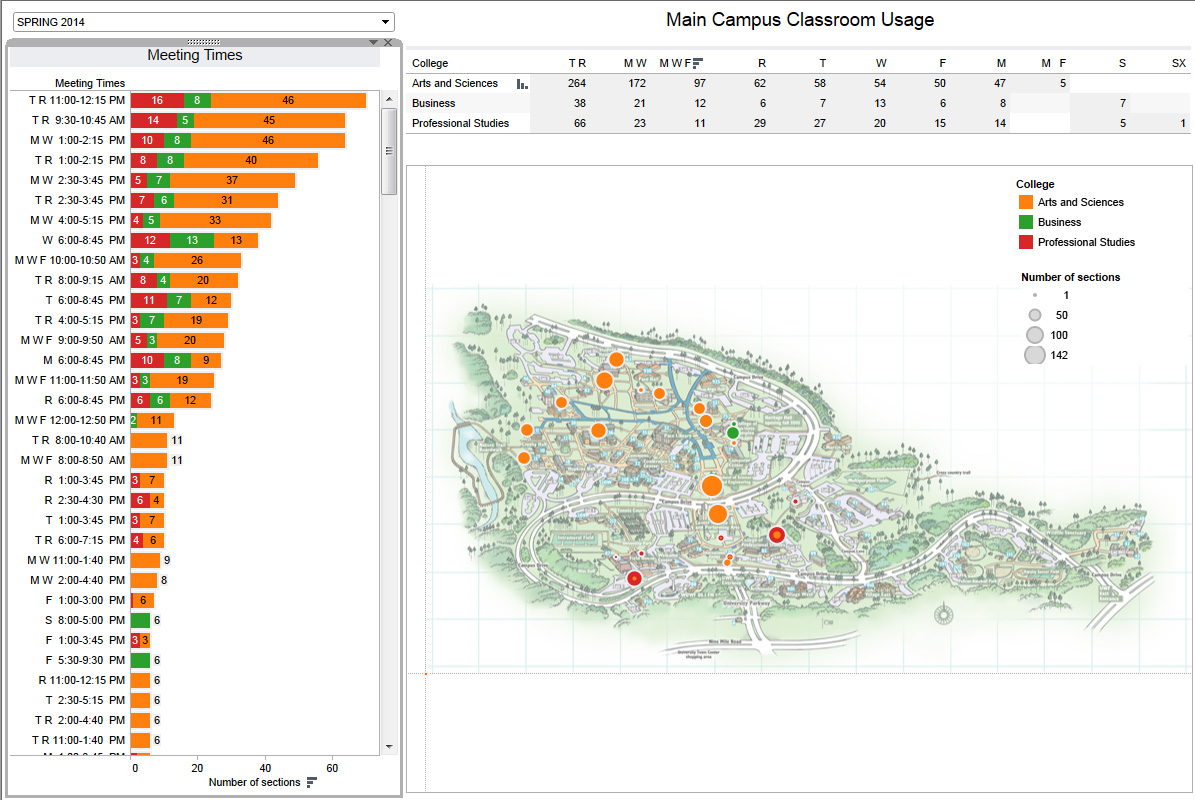
UWF Visualization of Classroom Usage
After its initial adoption of Tableau in 2008, the IT team quickly expanded its 15 Tableau Desktop licenses to a full core implementation of Tableau Server for publishing visualizations authored in Desktop.
“Before the end of the first year, we already said, ‘we know we love this product—we're going to go for it,’” says Haveard.
Today, there are 20 people at UWF using Tableau Desktop to author vizzes and roughly 100 people viewing and interacting with published visualizations through Tableau Server.
Haveard has used the data visualization solution to address wide variety of issues.
“The range of reports that I have produced varies widely,” says Haveard. “Things like helpdesk usage statistics, user analytics from our web portal, an analysis of classroom usage, and a look at a computer lab’s student use metrics to help decide a facilities question. You name it; we've written a Tableau report that pulls it in.”
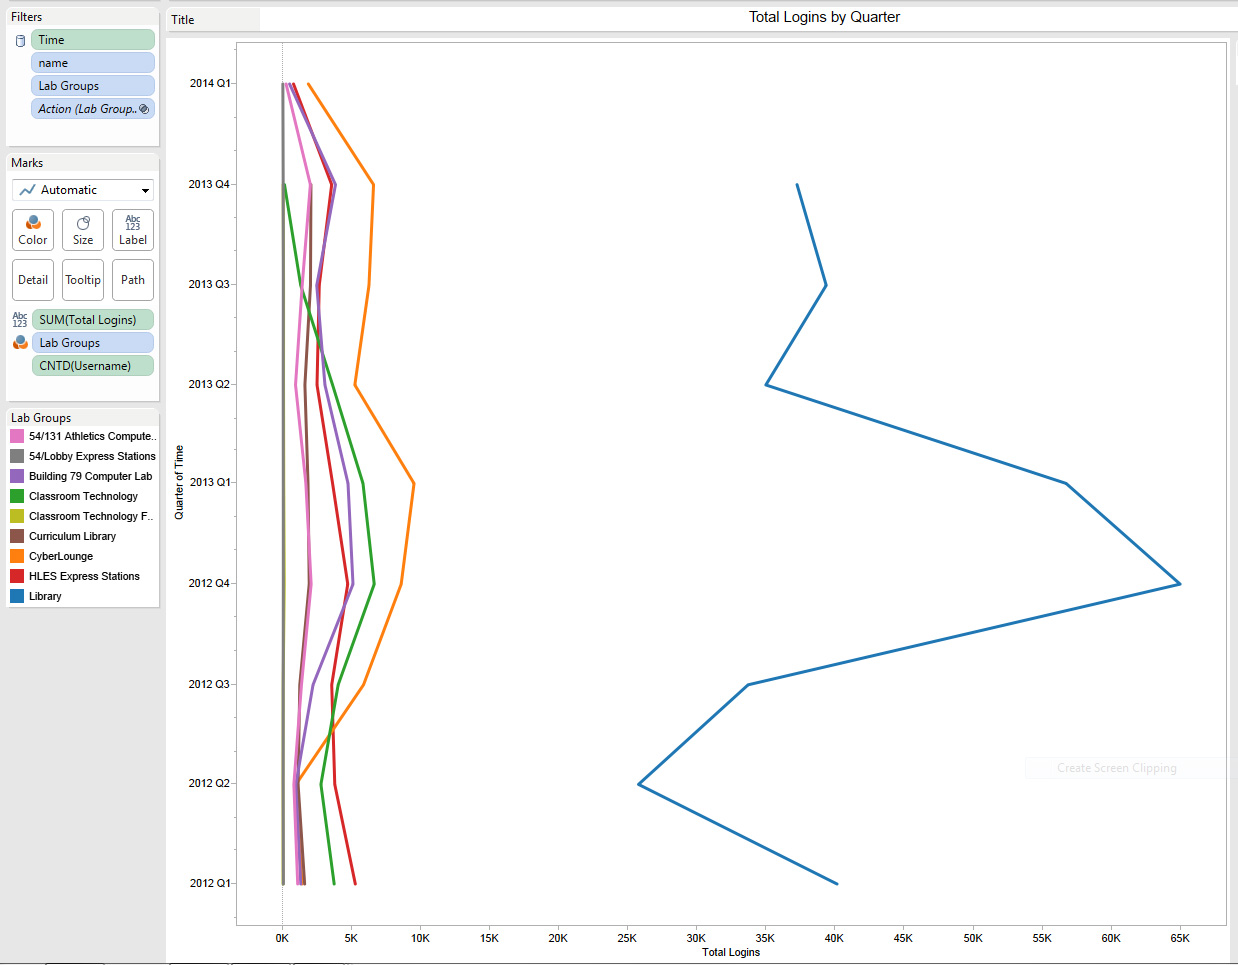
Computer Lab Usage Trends by Quarter
As such, it’s no surprise that she turned to Tableau to help with the newest challenge.
For each application solution that we put out there, we are cutting at least half of the time off of it by having a companion Tableau workbook. We’re talking 4 to 5 weeks of time saved per application.
Faster, Cleaner, More Complete Access to Student Data
Application developers have eliminated the need to spend time on reporting components because they are using Tableau as the reporting front-end.
“For each application solution that we put out there, we are cutting at least half of the time off of it by having a companion Tableau workbook,” says Haveard. “We’re talking 4 to 5 weeks of time saved per application.”
"They're not just saying 'I need a report.' They're saying 'I need a Tableau report.'"
Developers include a URL parameter within the application that links to the individual student. The Tableau visualization then includes that URL as an action, enabling users to navigate directly to individuals’ update pages.
“Our web application is slimmed down with a lot less application development needed. That definitely frees the application developers to do more important things—Tableau takes it all away.”
And the business users are so pleased that they have begun to request reports specifically in Tableau, according to Haveard
“They're not just saying, ‘I need a report.’ They're saying, ‘I need a Tableau report.’ They already know that they need all the bells and whistles, and they need the ability to drill down to an individual—they need all of that.”
Complete Views of Cleaner Data
UWF is also using Tableau to enable a complete view of student data—no matter where it resides.
“We were able to blend the data in Tableau, using the students’ UWF IDs. So we can keep working during this transition,” says Haveard.
And what would they have done if Tableau didn’t allow this data blending? “I think we would have just been pivot table happy. We would have had to try to do stuff in Excel with pivot tables, which would have been not nearly as effective—I can't even imagine!” Haveard exclaims.
Finally, visualizing the data before converting it is helping the team spot incorrect data entries.
“The errors pop right out of the data,” says Haveard. “You can tell when there are problems—it's just immediately evident.”
For example, when producing a VP-level view of incoming student GPAs, the team realized that the range included 393—an impossible score in a 4.0 scale. They were able to correct that metric to the correct 3.93—and avoid a falsely-inflated average.
“When we’re working with cleaner data on the front-end, then we can make better decisions,” Haveard points out.
Haveard and her team continue to expand their intentions for Tableau at UWF. Soon, they hope to begin visualizing graduate assistant’s grades, department assignments, and assistantship award amounts. They are also planning to use Tableau to support retention studies in order to extend the benefits of the university’s recruiting dollars.