
Castor powers COVID-19 clinical research across the globe using Tableau
Research platform made free for 200+ COVID-19 studies in 16 countries worldwide
Doctors and researchers' collaboration enables better allocation of limited hospital resources
Real-time advanced analytics allows ICUs to understand patient requirements and provide critical care
Castor is passionate about transforming medical research. Thousands of medical device, biotech, and academic researchers around the world rely on the Castor electronic data capture (EDC) platform to easily integrate high-quality data from any source and accelerate their studies.
Here, Castor’s CEO and Founder, Derk Arts discusses how visual analytics with Tableau – as part of the Castor EDC platform – is being used to better understand the Covid-19 virus, optimise valuable hospital resources, and ultimately improve COVID-19 patient outcomes.
Tableau was the first choice to underpin our COVID-19 program. It’s simple to use and incredibly powerful, and empowers people to understand research results considerably faster and more efficiently.
How is Castor’s technology supporting the fight against COVID-19?
Prior to launching Castor, it was clear to me that medical research and evidence-based medicine wasn’t making the most of data. Too often, decisions still relied on paper content, spreadsheets, or free text publishing. I set out to address that. At Castor, we see a future where all medical research data is machine readable, reusable, and available to all to improve patient outcomes.
When novel strains of viruses like the Coronavirus emerge, data is clearly our most valuable asset. This was true during the Ebola outbreak, where we already had decades of research into the effects and possible treatments, and it is doubly true in the case of Coronavirus.
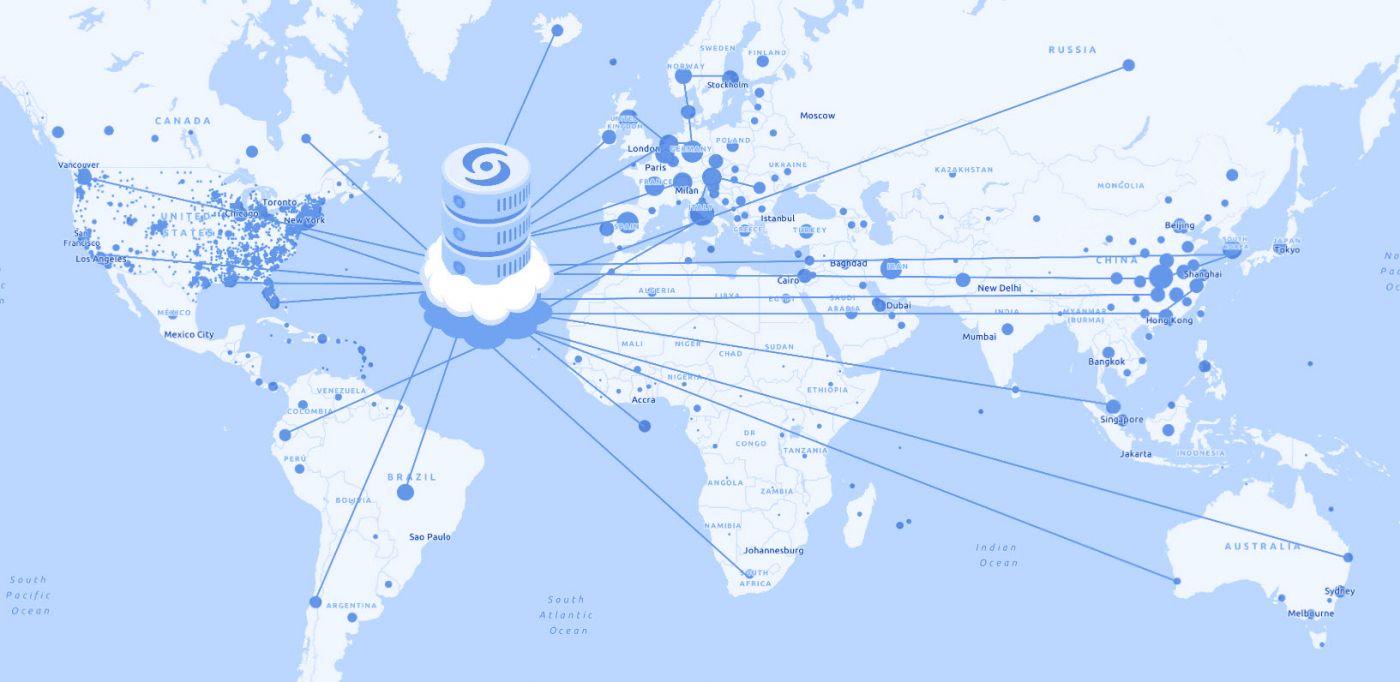
Castor’s research EDC platform is available for free for all COVID-19 research projects. We are now supporting more than 200 COVID-19 studies across 16 countries. And because time is of the essence, we enabled these studies to go live within six days on average. We developed pre-built electronic case report forms (eCRFs) based on World Health Organisation (WHO) standards, to help researchers start their study or registry in less than an hour.
How does Tableau fit into this COVID-19 research?
One of the best ways to maximise the impact of data is through visual analytics. And nobody does that better than Tableau. Tableau was the first choice to underpin our Covid-19 program. It’s simple to use and incredibly powerful, and empowers people to understand research results considerably faster and more efficiently.
We’re ensuring the optimal allocation of limited hospital resources and making certain the most grievously ill patients receive the highest level of care.
Could you share an example of COVID-19 research and how Tableau is being used?
Castor has made its EDC platform available for free to any non-profit research associated with Covid-19. And Tableau is an integral part of that. This is especially true in the case of the COVID-19 Predict study, a collaboration between doctors and researchers in the Netherlands to better understand and predict which COVID-19 patients should receive which treatment and which type of care. We’re ensuring the optimal allocation of limited hospital resources and making certain the most grievously ill patients receive the highest level of care.
Our EDC system is helping the Covid Predict consortium to easily capture data from multiple sources – it currently comprises more than five million data points. Algorithms for predicting disease outcomes are being created and tested with data that is retrieved in real-time through Castor’s API, which enables integration with a wide range of other platforms. These algorithms assist in predicting the probability that a patient will require intensive care, and if so, what the likely outcome will be.
Tableau enables people to understand all this quickly and easily. It provides an overview of admissions to the Intensive Care Unit (ICU), medium care unit, and hospital wards, as well as visualising patient outcomes and complications. One crucial dashboard, for example, shows the demographic age profile of admissions, the average admission duration, and the number of individuals either discharged from hospital, hospitalised, transferred, receiving palliative care, or who have sadly passed away.
This is remarkable and valuable work. What role has Tableau partner The Information Lab Netherlands played in supporting these projects?
All of this is made possible through the trusted partnership with Tableau, the expertise of The Information Lab, and Alteryx. In just a few days, for instance, The Information Lab created these incredibly powerful visualisations which are ultimately helping to reduce hospital crowding, protect staff, and prioritise patients that need to be hospitalised.
How important is it that healthcare providers become more data-driven?
Everyone needs to come together with a shared mission to see data as a trusted asset. Once data flows freely between researchers, clinicians and others, for example, it becomes possible to shrink research cycles and improve healthcare outcomes. Data is also everyone’s responsibility. We all need to be committed to using data to make better decisions.
Everyone needs to come together with a shared mission to see data as a trusted asset. Once data flows freely between researchers, clinicians and others, for example, it becomes possible to shrink research cycles and improve healthcare outcomes.